


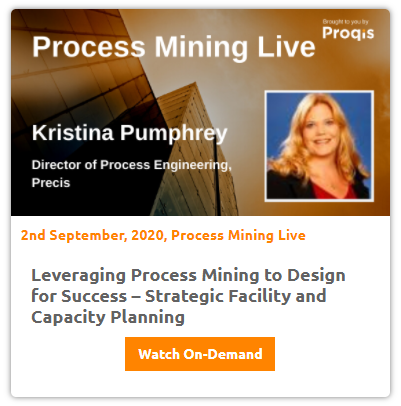
Courtesy of Precis Engineering's Kristina Pumphrey, below is a transcript of his speaking session on 'Leveraging Process Mining to Design for Success – Strategic Facility and Capacity Planning' to Build a Thriving Enterprise that took place at BTOES Process Mining Live Virtual Conference.
![]()

Session Information:
Leveraging Process Mining to Design for Success – Strategic Facility and Capacity Planning
There is a great deal of power in developing a plan for the future vs. reacting to arising challenges. This presentation identifies the benefits of leveraging and analyzing process data during the facility master planning phase to identify capital projects and operational improvements to meet future business drivers. The concept of incorporating lean six sigma tools and techniques will be discussed to understand current maximum capacity and quantify improvements to assist in making informed decisions that focus future investments where it is needed.
The presentation will discuss tools and techniques using specific examples from recent projects:
Leveraging data collected as part of a regulated industry
Lean Six Sigma tools and techniques to analyze the data to scope capital projects.
Project example using capacity analysis and specific metrics to provide a business justification for a capital project.
The presentation objective is to show that a planned, data driven approach to capacity / master planning, based on current operations, gives owners the ability to make informed decisions in designinga facility, not only for their current critical situation, but also for the growth of the business.
Learning Objectives: At the conclusion of this presentation, participants will be able to:
Session Transcript:
Next guest, we have directly from Philadelphia today, Christina Pumphrey, who is the Director of Process Engineering at Presses Engineering. Christina, great to have it with you, a bit more on Christina. She is a professional chemical engineer and director of processing engineering at Precision Engineering. She has over 20 years of experiencing assisting companies design manufacturing facilities in the pharmaceutical industry as a certified Lean six Sigma Black Belt. Christina uses her Lean manufacturing expertise to help clients plan for the future by improving operational efficiency. We're honored to have you very much looking forward to your presentation.
Thanks for having me. I look forward to it as well.
So, I'm going to share my screen, and we're going to get started.
So, welcome, everyone. Today, I'm gonna be talking about leveraging process money to design for access success, and really what it is to talk about how to use your SGX Facility Planning and capacity planning, and leveraging Lean six Sigma to do that and the data behind it.
So, regulated industries, like the pharmaceutical industry, inherently collect a lot of data.
Today, I'm going to discuss the type of data that is being collected, and how to leverage it to not only work more efficiently in your manufacturing facility.
But, also, how to use it to plan for the future.
As you can see from the agenda, we will walk through a strategic planning approach, and examples on how to use Lean six Sigma tools and techniques to scope Capstone projects, and use the analysis as part of the business case for the project using cost justification.
 Just a caveat, I'm no expert on the technology side of data collection and process mining. I would love to some of our other experts speaking at the conference, to talk about how to interpret that, How to collect that data, and be able to interpret it through programming and the computer system.
Talking a little bit about what the data that is already being collected. one of those is process parameters. Those are easy to leverage because they're being collected separately through IO. And usually alarming when you press when your pressure and temperature and other parameters are trending out of spec.
There's a lot of information collected in the batch records and other areas. If the bachelors setup electronically the inserted data can be pulled automatically. But there's still a lot of facilities still using paper records and that data isn't getting entered electronically anywhere.
Data in batch records like cycle times, raw material, actual quantities, yield, and deviations, are things that you can find within those batch record.
Some other data to think about collecting is the operator that's usually found by their log login And cumulative throughput and rejects are also very good information to be collected.
Collecting data doesn't really help much. What is really needed is the interpretation of that data.
It needs to be, you need that downloaded, download the data into a format that can be easily analyzed.
Best is if there's a program that does it for you, but it can also be as simple as an Excel file that does the interpretation from the downloaded raw data.
We all know that if it isn't easy, it will get done.
Here are some examples of interpretation interpreting the data.
First is the Control Chart, which plots the operating points.
Within the control boundaries, this is good to see trends, and when approaching the control limits, this can help predict deviations, but I've also seen it to be beneficial for preventative maintenance.
Especially when talking about things like rotational devices.
You can predict failures, but it can also be used to extend preventive maintenance durations.
If you are approaching the control limits, you may be able to go another 6 to 12 months longer until you need service, and this can save a lot on operational expenses.
The next example is plotting cycle time curves, which is your standard deviation against your cycle time, and your frequency.
It helps to identify which steps have a lot of variation, and when we improved by standard work, extra, exercise to shorten the cycle time. If you can go from a more flattened curbed to a lower standard deviation, you know that you have a much more reliable process with shorter with most likely shorter cycle times.
 Now, I'm going to talk a little bit about strategic planning.
It really is worth the effort to spend a little bit of time, strategically planning for the future.
The first step is to do a capacity analysis, and have an understanding of what you are currently making by tracking throughput.
And, more importantly, you want to know, what is the maximum throughput you can make in your facility.
Then, when you compare it against market forecast, you can identify where the gaps are to meet the demand.
From the gaps, that helps to develop a list of N scope for capital projects.
Sounds pretty easy, right?
Well, the final presentation to management should look that way, but there's a lot of data and analysis that is needed to go into that presentation.
I'm going to take you through some tools and examples to show this approach.
You can use collected data to track actual throughput, which is this black line.
But do you also want to know what the max number of batches are?
So if we just take a second to look at what this table is here, what you're looking is, demand is a demand chart that looks at your current demand versus your forecasted maintenance.
It goes against doses, is what we're looking at on the life on the left side. And in this particular case, we're talking about vials.
And also, we're looking at against the year of the rejected domains. The different colors that you see in the bar graph really represent the different products of this facility.
So, as I said, the black line is showing what the actual demand is per year. That's being done. And you also need to know the maximum capacity.
What we're looking at here is, they were fine up until 20 16, but, in this specific case, there was a large demand between 2016 and 2017.
There wasn't enough time to really get a new fill line, that would take a couple years, So, they had to do something to be able to increase capacity.
Therefore, operational efficiencies had to be done to get more throughput.
The easiest is adding additional shifts.
The third shift and even Saturday, it can make a large impact, but you should also realize that, with a 24.7 operation, you're losing time for maintenance and makeup time if you're behind.
Some other options that you have an increasing throughput is I N equipment, but this is usually a long term solution.
You may be able to find some items that can be added and increase throughput within the next year, but a lot of this require planning, and capital, and, and, and a capital project.
Finding ways to reduce cycle time and improve efficiencies can also add to your capacity.
Support areas are usually where you see the most gain. And we'll go into a few examples later.
As you can see from here, doing some of these operational efficiency improvements. We're able to let them squeak out more capacity in 20 17.
But it certainly isn't going to be enough to meet the forecasted demand for 2018 and that's going to require a capital project.
I believe a lot of this RP audience has an OpEx background.
So I probably don't need to tell you to leverage operator experience, but it's worth pointing out.
They know where the issues lie, and a lot of the time how to solve them.
They just need the time, money, and motivation to get it done, And in my experience, someone who can listen and get the solution to the right person.
Often summarizing the information, illustrating this way really helps to get everyone's attention, because you can see a lot in just one vision, and you know, there's no way you're going to be able to make it from here to here without doing something.
During the capacity analysis, you usually engage the design team to start contact design.
The team helps to identify the gaps involved with expanding capacity, especially on the facilities side.
What we're talking about is looking at the facility layout, your gaps in your utilities and other things on the design side along with the gaps identified during their capacity and apsis.
And for anyone that works with forecasted demands, you know that they changed yesterday.
It's never always stay the same. And usually, you get a new one within every quarter that changes every.
So it's really important to understand how they will change and the level of risk.
For example, maybe syringes put you may have products and syringes and products and Biles, which require different types of filling lights.
There's even new products in the pipeline.
And you really want to understand how these risks and these changes are going to impact your assumptions for your capital projects.
Usually, what I hear from my clients are, I want a flexible design, which could be anything under the sun.
So it's really important to add some boundaries around that flexibility. That helps meet the objectives and focus the design and the cost.
So now there is a long list of wants and needs.
 It helps to rank the items on impact an effort to help narrow down the gaps and options.
It also helps to look at the item's objectively.
To close out the effort, you might want to limit options at most, two, maybe, three, and develop your project cost and your schedule.
This is also accompanied by a Basis A design, which really outlines the different options and the supports, the project scope to support the cost estimate and the schedule. And, ultimately, you wanted to make a recommendation based on the information at the top.
Now that I've taken you through the approach, I'm going to show some examples on how to evaluate and incorporate those operational efficiencies, which I'm going to identify as improvements.
You really want, you, right now, you have a list of a potential, and you should have a list of potential improvements by area, and they should be ranked by short, medium, and long term.
As we discussed in the previous slide, ragging, there were improvements by impact, which is things like throughput and staffing, versus the effort, and at this stage, that's usually cost and schedule.
It helps to give you a more objective look at which improvements to include.
It's also important to make sure you would evaluate the combined improvements.
one improvement may have a negative effect on another.
A good example of that is, if you were increasing your batch size, This helps to reduce quality tasks and cleaning tasks that are set up on a per batch basis.
But there's more time spent, probably picking and K, in raw materials and components, and that may increase staffing requirements in the warehouse, which was reduced by another improvement.
This gives you a good ways to look at identifying improvements.
Usually if you have a continuous or OPEC's department, there are some effort of process mapping, where you identify value added activities, which is really the core process, the things that are added to the product, that add value to the product, versus non value activities, which is kind of an idealist view, which we consider wasted effort.
In the pharma industry, there's a lot of unnecessary waste things like cleaning and quality testing.
That doesn't really add value to the product, but it can't be eliminated and is required in manufacturing.
But in my experience, you can make the most impact on the noun value activities.
We focus so much tension on the core processes that usually, these areas are already inherently efficient.
By reducing those core processes, you're really looking at what the traditional approach is.
You really only see a small impact in cycle times.
But if you can focus on more of the non value wasted activities, and reduce the cycle times there, you can really have a large impact on the overall throughput and capacity of your facility.
To evaluate impacts, it helps to use the priorities.
I prioritize Asian chart to objectively look at the different improvements.
You quantify the improvements based on impact, which we said is things like throughput, and staffing, and effort, which is cost and schedule.
There is, when you look at schedule, you really want to include the full schedule and pharma and regulatory environments. Regulatory and FDA Review is sometimes part of that schedule, which can be, which can increase a lot of time into your sketch.
Once it's ranked, it falls into the following: Quadrants, it has a low impact, but a low effort.
We call that billon or low hanging fruit.
This can be done quickly, and it can show improvements fast.
Now, if we have.
Low impact.
A low effort, but a high impact, this is considered a quick win.
I mean, it's going to provide a lot of benefit and not a lot of effort. So, this should be done and started as soon as possible.
.png?width=742&name=Screenshot%20(4).png) And the next quadrant over here means you have high impact, but it's also high effort.
And the next quadrant over here means you have high impact, but it's also high effort.
We call this a major project, but it's usually worth the effort.
The quadrant that you really want to avoid is right here, where it's a low impact but a high effort.
Is it a thankless task?
Over here I'm going to show you a few examples that fall into these quadra.
So the first one is fair hearts and clean.
In this example, this was for filling mine.
And after you're done filling, you usually have to pull out pieces and clean them out of place usually in a washer and also sterilize them in an autoclave.
If you can have a set of pair parts that have already been clean and sterilized.
When you finish your operations, you can take those pieces out and replace them with the clean and sterilized pieces. Eliminating that portion of time waiting for it to be clean and steamed out of place.
We put specific requirements are impacts specific metrics on the impact.
And what we saw here was that it would have a reduction of two hours in the cycle time and it really did a good job of eliminating Saturday overtime.
The impact was the only value that About, This gave us that.
It was a small impact, but the effort really wasn't too bad either. It was only going to cost about $35,000, and it would take four weeks to install.
So this fell within the Quick Wins category of the, of the prioritization chart.
The next example is Visual Inspection Machines.
So, with this, it was a very manual process where personnel and operators were reviewing the labels manually.
Once I got up, we evaluated the impact of adding visual inspections machines, which would add that as an automated approach.
The impact of that was a reduction of six hours, of cycle time, which added an additional two batches.
And we also saw some staff reduction due to it being more of an automated attack.
This is the effort, landed us here.
And that was $100,000, in cost, and was going to take about 20 weeks. So, it was going to be a pretty large effort, but we also evaluate, is to be, is a very high impact, as well.
I talked a little bit about what happens when you increase batch size. This eliminates some of those per batch tasks to have less kiddie. Let's set up and cleaning times that you see as well.
We evaluated this impact to be an additional eight batches per year, And it would only take about 12 weeks to implement.
So, we thought that this was very much a high impact and not a low effort.
This is definitely a, A must do project.
Sorry. We are sorry. This ended up here.
So, finally, the last one was looking at increasing shifts, so six days a week, manufacturing.
It was only a half day on Saturday.
And when you looked at the impact, it really had no additional batches.
It improves support, But it also creates more makeup and rework.
So this really had a low effort, and it was also very expensive and took a long time.
So that puts you in the thankless task. And this project was eliminated from our improvement list.
So that just shows you a few examples that demonstrate how to use the priority prioritization matrix to really have a more objective view on your improvements.
Now, I want to take you through some lessons learned, and some things to watch out for when you're doing this app.
Talking a little bit more about the changes in market forecast, you really want to evaluate competence and risk.
Have a good understanding with the marketing team on where they expect the changes to happen within this forecasted demand. That gives you a better understanding of what things should be planned for head.
And what things that we know are pretty much set in stone.
Another way to handle this is sometimes you can delay your decision by increasing improvements.
And that can then delay the decision until you have a more concrete path forward on your market fork.
I also talked about your boundaries on flexibility.
You really want to understand what those objectives are, and how you can plan in your flexibility.
one example of that is planning spaces for changes.
So you can have shelf space, and you can have clean rooms with nothing in it.
That gives you some flexibility that when you do know how you're proceeding, you still have some of that project already done, which can reduce some of your your implementation time for that. Expect those items.
Another example is within filling the syringe at byline.
What we're looking at right here is, in this example, they had a combo syringe and by allying, at this point in time, which really gave them a lot of flexibility, to be able to do both types of josey.
But once you get into demand up in this area, usually you can't use a combo line and you have to have dedicated, violent, syringes long lines.
So it's important to understand which one is going to be more or understand what how much your product mixes are going to be in syringes and files. So, you can plan to know how many syringe lines you need and how many byline too.
And that's a good example of showing how these forecasted demand can sometimes impact your your decisions at that time.
For this specific project, they made the decision to go with byline.
And later in the future, there's a branch product had more demand, and then their bio product, and then they were scrambling to put it in a syringe line after the fact.
The next one is making sure that you have realistic lead times.
You need to understand cycle times, it's not just time to process, but how long does it take to clean and changeover?
And when you can have when and what else needs to be done before another batch can start, often, the earlier prod product has to be fully out of that room, and that room it needs to be cleaned and changed over before a new product can happen.
So it's really important to understand how you're going to operate.
Even if it's only one product, you still need to do cleaning and changeover depending on Jo's concentrations and dose sizes.
You're also usually not at 24 hours per day.
So you also need to understand shift changes, and when to stop for the day.
So, putting together a chart like this, We have a better understanding of the color codes really talk about a specific product and which room they're in, and when you're doing changeover, which is these black lines here, this really gives you a better understanding visually on how your products are moving throughout your facility.
It's also important to understand fully types when it can't be just distributed and storage requirements.
So look at this lead time you're processing for your product.
Really, it's only a small fraction of the overall lead time of your process. When you add in raw materials, processing, finished goods, staging, quality, testing, and consumption.
On this example, quality testing had to be sent out and it took a full two weeks to be able to get your results back.
That really needs means you have to You have to be able to plan for those storage requirements because you're making more product as you're waiting to send out your product that's already been made.
All this work has been done analyzing the data and justifying the options.
You really should use it to show your due diligence and build a business case for the product project.
Cost justified justification example. What we're looking at here is a cost just to fixation example for the capital project of inquiry of including a new, faster tablet press.
You really want to put dollar values to the benefit of the investment.
We're looking at throughput, labor, downtime, and other items.
So in this example, they're looking at a new tablet press that will increase their throughput 100 tablets per hour, and also will increased equipment utilization.
So being able to quantify that, that was an increase of about 430,000 doses per year, which translated to $345,000 per year.
There also was a decrease of two operators, and I just wanted to note, this isn't always a decrease in operators. Sometimes it's just, you would have expected an increase in two from the current state when you add another tablet press.
It can also be reduced over time, and there can also be shared operators.
The decrease of two operators was a cost savings of $52,000 per year.
For the maintenance side, we tracked work orders, and subtracted man hours, and components.
That gave us a reduced cost of $38,000.
There was also some additional cost of goods with the increased throughput, and this is things like utilities and components, and that was a, an increase expense of 12 that when you add all this up, you could justify $425,000 per year, third capital investment of approximately one point three million dollars.
But you've justified it, and you also have an ROI of three point a little over three years.
This makes it, I'm showing the information. This way makes it a little bit easier of a pill to swallow when you're asking for money for your facility.
So, just a conclusion, I hope you've learned a few things, to leverage the data collected and develop a process to interpret it.
Spend time to strategically plan.
Do this by understanding not only your current manufacturing capacity, but also your maximum capacity and how it relates to forecasted demands.
It's also important to understand the risk and your expected changes to your future demands.
Then you should lever that, Leverage that, analyze data to make decisions and develop a scope and a business case for capital projects.
Any questions?
Interesting, that, thank you very much! I'm monitoring for questions here. And then, I always start with some commentary that there was, you know, there was a great view of really traditional approach for mining processes, for improvements and innovations hears about the, any aspect of technology that may have used in that work. Was there any part of it that was driven by certain technologies?
Well, I know a lot of it is.
Know, I tried to spend a lot of time of how you can, using the technology, to try to get it into a format that you can easily, easily analyze.
Um, if it's, a lot of times, it's just data that's just sitting there, and no one does anything with it.
So, there's a lot of things that can be added on the backend, where you can pull the data and put it in a format that then, you can see those control charts.
And, you can see those cycle times automatically, and then you can look at it forever. You know, you can look at it periodically, isn't this large project that has to happen every year, where you're spending all this time trying to look at the data. If it can happen easily, it makes it much easier to interpret.
Very good.
I think one of the things that you demonstrated very powerfully is that in a discussion where we have, you know, big data and advanced technologies to look at things.
The Dia, often, small data and with high quality, can give you so much greater insight on what to ask, what's actually going on, when it comes to driving real improvements and innovations.
So, much of the work that you have done here was data that was automated, and you investigated, or, or, or, really, was, more, like, small data. Where, what I call by small data is, that you had actually smaller sample sizes that you observing, and they're using to verify some of the actions that, that, that you needed to take.
I think a lot of this, because I'm a big proponent on where that data is already being collected and then, gain and download that, and reviewing that analysis. I didn't do that much in terms of time studies or things like that, where we were really in person watching that. There were things that we could do for life cycle times, instead of time studies. In one of the particular cases for the toggle press, the room gets changed in status, so we know when it's in processing, we know when it's clean. We know when it's back to ready. We use that kind of data there and those changes and statuses that's already being largest somewhere in the the you know, audit process automation system that we can then use that as our cycle times and use that to understand where we're having some variances and cycle times.
Um, the one place that I wish people would do more of is batch records and throughput. Because that really isn't being even if it's electronic backward records. I don't see that getting put in a repository anywhere.
We kind of have to look at sometimes that FAPE and where the receiving, you know, what is being shipped out and the doses being shipped out and kind of pulling it from other areas, it's not automatically correct collected. So I think it was a mix of data that's already being collected and then some work to try to figure out how to interpret it.
Love that, I love that. As a matter of fact, William Fuller had a question just on this that you just answer, Which is, if you, if you are a source of data came from ERP systems and the like and you, and you have just commented on that. Another question that came up, maybe, from the more purist Lean practitioners in the in attendance here, is that you highlighted that the bigger batch sizes were actually a form of improvement to accelerate cycle to reduce cycle time. Of course, that's just the opposite Little's law and when it comes to Lean processes. So, talk a little bit more about how bigger batch size is actually help reduce cycle time because that was a little bit counter-intuitive for a lot of in the audience.
So I don't know if that's just something that comes from pharmaceuticals and a regulated industry. But for every single batch, there's a number of samples. There's quality testing, that has to happen There, setup times, and cleaning. That has to happen between every single batch.
And a lot of times, those areas are some of the highest wasted items. Where there's a lot of ability to decrease cycle times.
Gotcha.
So if you can decrease some of those batch activities, batch based activities, by having a larger cycle, by having a larger batch size, you can have some large impact within it, but then there are some, there's some negative sides of that that you have to evaluate. So for example, you have to do a lot more picking. It takes longer to process it, because you now have a larger batch size.
There's limitations on your equipment sizes, so you can only go to a certain batch size.
And even sometimes it is monitored by how big your batch sizes can be based on your regulatory filings with the FDA or even on no controlled substances if we're talking about maybe DEA, controlled substances. So if you have to look at it from different areas, but I think within the pharmaceutical industry, there's a lot of waste around things that have to happen on a per batch basis.
Got, you know, that was very helpful. So it looks like you've discovered this additional capacity right in the facility by doing, you know, several of these improvements. Curious, You know how things have progressed, not just in that facility, but maybe in other places that you work on. And this specifically with the background of ... and the impacts that he has, the head in many processes in the pharmaceutical industry, curious about potential impacts, that covert it has had in your business, and the in your operations.
Well, it's been super busy and cynical industry, I don't know if we ever really slowed down. We're just trying to find ways to navigate things. Even doing, like, ... through video conferencing like this, because we have to kind of continue, Some projects are too far along, on some projects, are put on hold. And then, there's a bunch of projects that are coming just based on covert 19 and, and, you know, the race to get vaccines to market.
Um, what does happen is, if you have done this capacity analysis, you can respond to this big change that no one knew was coming very quickly, because you know how much additional capacity you have in your facility, you know, where you have areas for flexibility. You can kind of be the, the facility that says, hey, I have capacity bring that vaccine to, to our facility. I mean, a lot of times, if we're talking about big pharma, this, the facilities are all competing against each other for some of those products and that capacity to help keep them at high utilization.
So being able to respond quickly to having additional capacity, that's where you were seeing a lot of that.
That we actually the coven 19.
And the And how do you see the progression on on your improvement and innovation efforts?
Are you, Are you still seeing a need for improvements in efficiency isn't related to capacity? Or, or is your attention when it comes to prioritizing opportunities for improvement innovation, are there migrating elsewhere in other parts of the business? So, what does the portfolio may look like today?
I think it all really depends on specific clients, and what they have internally, and if they have taken on a continuous improvement environment or not. If there's an internal OpEx department, actually that helps me out a lot more because they understand where I'm coming from, maybe collecting all that data already, and it makes it a little bit easier to do that.
I know there's always the need to, not only have additional capacity, but do a lot more for less money money. You're always fighting for a piece of that capital projects, budget yearly.
And I see this is helping in twofold. one, it really helps to understand what you can do with the facility that you have now, with when you don't have those budgets.
But also, if you can demonstrate that you really have a good understanding and done your due diligence and how your facility works and really show the justifications to all the money that you asked for. You become a very reliable facility within your organization, and they'll send you stuff. You know, they'll send you extra products because they'll know you guys will find a way to get it done. So, that's where I see a lot of the use of this.
Very good. And one final question, What do you think are the biggest lessons you have learned by taking, but with the organization taking more of this strategic planning approach that you share with us? What, if you look back, what have been some of the, the key takeaways for you?
I think the key takeaway is that there's so much of a reasoning to be very reactive to changes and things. You find out, hey, we're we have to change. We have to put this new product in. Or we have to do something like that. And you just, automatically, we're like, OK. We need a capital project, and we need to do it tomorrow, and you rush to get it done.
If you really understand how your facility works, you can you already know, when you get that information, you've arch analyzed the different options, and probably can respond proactively, and say, OK, well, we thought about this. And we know that we have to implement these set of prog projects for this case, of a scenario.
The other thing that I've learned a lot is, you know, all of this stuff, you talk to the operators, they already know how to improve the areas. They kind of know what's going on.
And you, once you start digging deeper, you will understand that they just don't have, sometimes they don't have the means to make those improvements. So, if I can be the facilitator, that helps to get the funding and also get the correct management to understand what needs to change and fix those challenges, then that's very rewarding for me.
That's excellent. Christina, thank you so much for taking the time to sharing this experience and journey with us. We very much appreciate that.
Thank you, Josie, and I also want to thank ProQuest for the opportunity.
Thank you very much.
All right, ladies and gentlemen, this concludes, they chew off process mining life. So let's take a quick look at what we have in store for tomorrow. We're going to start today with the leader, for Salon is talking to us about achieving process excellence by combining artificial intelligence, process mining, and task mining. He's going to do, is share with us some case studies related to the application of this combined technologies.
Right after that, we will have Janice Minister, who is the global change manager for Warner Media discussing the impact of ... Cove at 19 and the application of process, process management, and in her environment. In the, meanwhile, it turns out to be, you know, a media organization. We're gonna follow that up with the Vice President for UI path, improv in process mining, an expert in process mining. And, he's gonna talk to us to learn why process mining itself provides little value.
Now, take those of that. We have the Leader for Process mining, one of the leading organizations in process mining. Tell you how process myself provides little value. So you, you want to listen to that, and you'll understand why he's taking that position, because I think it's a very vulnerable position that he's going to share with us.
And, and we're gonna finalize tomorrow with doctor Mark McGregor. And doctor Mark ... is going to have a very interesting reveal of business processes, technologies, discussing mining, modeling, or management, where you should place your batch when he comes to creating the most value for your organization. A very interesting presentation as well. He takes, perhaps, some contrarian position when it comes to certain items related to process development, business Development, technology. Very interesting, very entertaining, I suggest that that you stick with us tomorrow to wrap up the conference with doctor Mark McGregor.
Today, we are completed. I hope you have a wonderful rest of your day wherever you are in the world, your morning, afternoon, or evening. Enjoy the rest of your day, and I hope to see you tomorrow here at this channel early on. Thank you.
-1.jpg?width=200&name=small%20(2)-1.jpg) Kristina Pumphrey,
Kristina Pumphrey,
Director of Process Engineering,
Precis Engineering.

-2.png)
-2.png)


.png)

.png "Access all 75 Award Finalist Entires")


