
BTOES From Home - SPEAKER ...
Courtesy of Nintex Pty's Paul Hsu, below is a transcript of his speaking session on 'Improve employee productivity during and post-COVID by ...


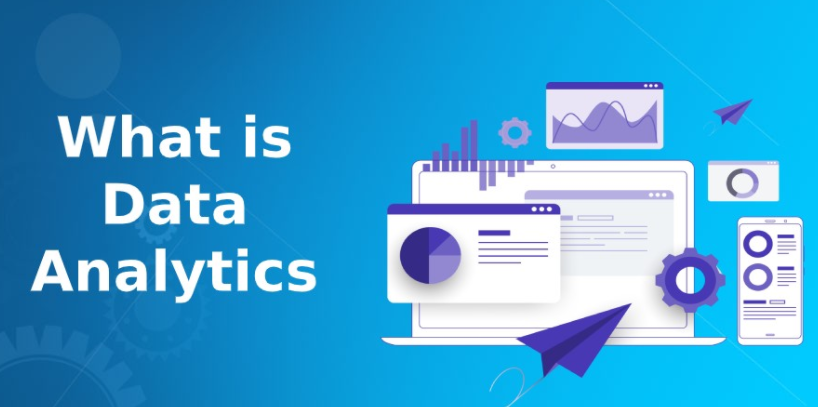
Data analytics is the science of analyzing raw data in order to make conclusions about that information. Many of the techniques and processes of data analytics have been automated into mechanical processes and algorithms that work over raw data for human consumption.

By collecting various kinds of data from numerous sources, you can gain insights into your audiences and campaigns that help you improve your targeting and better predict future customer behavior.
One valuable type of data is information about customer behaviors. This refers to data about specific actions that a user takes. They might, for instance, click on an ad, make a purchase, comment on a news article or like a social media post.
This and other types of data can reveal information about customer affinities — expressed or suggested interest in activities, products, brands and topics. A customer may express interest in your brand by signing up for your email list. They may also indirectly express interest in a topic by reading about it on your website. They may express interest in a product by clicking on one of your ads for it. Some other potential sources of customer affinity data include survey responses, social media likes and video views.
By combining this data with information about your current customers’ demographics, you can gain insights into the customer segments that are most likely to be interested in your brand, content or products. Demographic information includes information about customers’ ages, genders, income, marital status and various other characteristics. For example, you might find, through data analytics, that people between the ages of 18 and 35 are the most likely to purchase your product. You might also find that people who are married make up most of your website’s audience. By targeting multiple characteristics, you can create more specific audiences who are highly likely to convert.
You can then use this information to predict the behaviors of various types of users and target your ads and content more effectively.
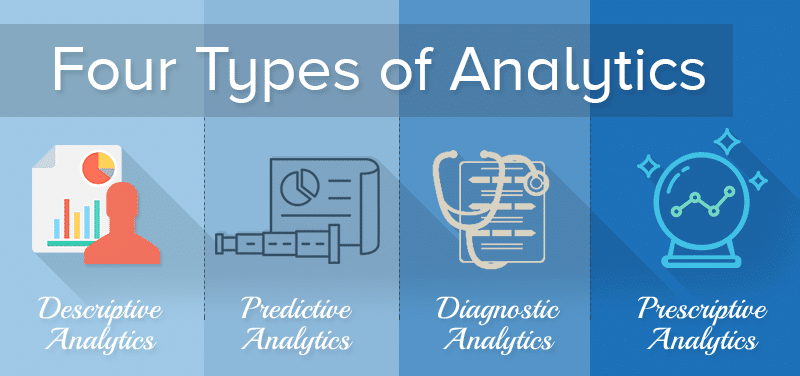
Data analytics is broken down into four basic types.
.png?width=1920&name=BTOES%20AWARDS%20LONG%20-%20NO%20DATE%20(1).png "BTOES AWARDS LONG Graphic")

-2.png?width=1200&name=BTOES%20Awards%20Logo%20Base%20(5)-2.png "BTOES Awards Logo Base (5)-2")
-2.png?width=1200&name=BTOES%20Awards%20Logo%20Base%20(4)-2.png "BTOES Awards Logo Base (4)-2")


Courtesy of Nintex Pty's Paul Hsu, below is a transcript of his speaking session on 'Improve employee productivity during and post-COVID by ...
.png)
Read this article about HP, Best Achievement in Operational Excellence to deliver Digital Transformation, selected by the independent judging panel, ...
Read this article about BMO Financial Group, one of our finalists, in the category Best Achievement in Operational Excellence to deliver Digital ...
Read this article about Cisco, one of our finalists, in the category Best Achievement of Operational Excellence in Internet, Education, Media & ...


.png?width=300&height=300&name=LINKEDIN%20AWARDS%20GRAPHIC%20(1).png "LINKEDIN%20AWARDS%20GRAPHIC%20(1)")


