


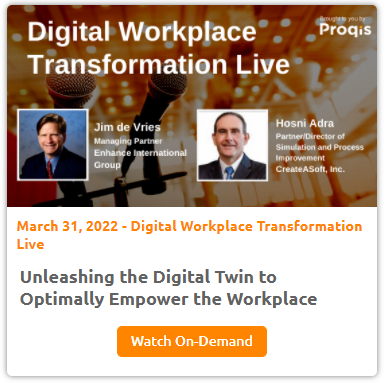
Courtesy of CreateASoft's Hosni Adra & Enhance International Group's Jim de Vries below is a transcript of his speaking session on 'Unleashing the Digital Twin to Optimally Empower the Workplace' to Build a Thriving Enterprise that took place at the Digital Workplace Transformation Live - A Virtual Conference.
.png?width=300&name=BLOGS%20COMPANY%20LOGO%20(27).png)

Session Information:
Unleashing the Digital Twin to Optimally Empower the Workplace
After more than two years of lock-downs, many facilities are finding themselves struggling to find workers. With an ever-growing demand for locally sourced goods, there is a shortage of facility workers –
There continues to be pressure to move to local manufacturing while maintaining or reducing costs. Therefore, this is the era of the automated factory … doing more with less workers.
ERPs provide linear Supply/Demand planning. However, the non-liner complexities of Sales and Operational Planning (S&OP) and Supply Chain Risks continues to cause havoc in the workplace resulting in firefighting and non-value added activities costing companies millions while losing customers. Real-Time monitoring and decision making are therefore required in order to reduce the impact of the dynamic complexities of the Supply Chain (Plan, Source, Make, Deliver, Return). The solution requires a Real-Time, Data Driven Digital Twin with integrated Neural Networks to leverage Artificial Intelligence, and enable dynamic learning (not available in ERPs).
This Webinar demonstrates CreateASoft’s digital twin technology that leverages learning algorithms using Neural Networks (AI) to generate sustained benefits that enable the workers to maximize their performance, drive sustained profitability, and exceed customer requirements.
Please join Hosni Adra, Managing Partner - CreateASoft and Jim de Vries, Managing Partner, Enhance International Group (EIG) for an insightful webinar demonstrating capabilities and providing you our proven 90—Day Roadmap to Digital Twin Sustainability.
Session Transcript:
The most powerful leaders of culture, business, and digital transformation, and I'm talking about Jim, the rays, and Hawes and the ..., who are going to unleash digital Twins on us to optimally empower the workplace. So, Hosni and Jim have presented at several of our conferences before. They talk about every topics related to digital, business, and cultural transformation. And it's a real honor and privilege to have both of you, back, again, sharing your wisdom and expertise with our global audience today.
Thank you so much, Josie, for having us. We are honored to be here.
We look forward to a fun and engaging discussion here on digital twins and sharing the great knowledge that ...
has created over the years, and spearheading digital twins, and Josie and procreates.
Thank you so much for the opportunity to present, are very humbled to be here.
As, as Joseph had mentioned, our webinar's focused on real time, digital twin to enable and optimize the workplace.
So, again, this is real time, uh, real time digital twins, and.
And so we'll just get started here.
We all understand industry four, supply chain, for, now, it's all about digitizing the workplace, And they're all the whole dilemma is, is, how do you get all that data in the central location?
And then, digitize it and make decisions.
It's all about how do we make our decisions faster and better, so that we can optimize our work planning, and, as we know, in this book, a world that we have, and we'll talk about VOCA in a minute, in the first section, and talk about how dynamic this world is today, we're not in a linear world.
Most AARP's are focused on linear Sanofi, so we're talking about SOP and relating that to the workplace, every employee is affected by the ... Plan as an LP plan.
If they say, No, P plan is not working, people's lives are not good.
So, we're going to make the world a good world and, and we're going to talk about the impediments. So, we're in this virtual landscape.
What is Volcker, Volatility, uncertainty, complexity, and ambiguity?
And it's, through these things, these things that are happening, especially in this covert world of uncertainty and volatility that, we are, really, need something that can handle the nonlinearity of our supply chains.
We have discrete events throughout the supply chain of getting things through, and it's optimizing these discrete events.
And, and we would like to see it all nice and smooth, but in reality, it's this complexity of the many different nodes in your supply chain, the uncertainties. Will you have it? Will you not in ambiguity and how things are going to be changing?
 So, from a supply chain perspective, this is all described within the bullwhip effect. So if you're a supply chain person, you all know about this.
The bullwhip effect is the uncertainty cost from distorted information flowing up, and down the supply chain. So what do we mean by that?
From a demand perspective, a small perturbation and change in demand is going to chart create a very large amplitude impact on at the supplier level. So it's a cascading from the customer retailer, wholesaler, manufacturer and supplier. That's what we're seeing here.
Customer demand is changing dramatically.
one day, cut me off, next day. Why can't you make enough?
Then from a supplier perspective, we have these distortions from the foundry, there's a lack of supply. We have geopolitical risks.
We have, like in the Ukraine, with precious metals.
All these types of upsets throughout the supply chain are causing us problems.
We have all of our cargo containers in the wrong place at the wrong time.
All these things are causing a supply issue and it's cascading and warehouses are overflowing.
and yet, we don't have what we need.
And what we called with this supply chain Risk Management Consortium is the W recovery.
So, what do we mean by the W recoveries? There's going to be lots and lots of ups and downs. And we've seen it over since the beginning of ..., we call it back in 20 20, that we're going to be in this W recover.
So, the question is, how do you deal with this?
And the answer is a Digital Twin that is dynamic and is learning, and that's what we'll be getting into.
And if you look at again, the 100 and ones of supply chain, you have the win for suppliers is aggregate instead of your supply requirements.
That's what we want, but we don't have that now.
The win for consumers is is Reliable Availability.
Again, we're having it pulling in that direction.
So everything from supplier to stock and consumer to stop those variability are going up and down and you may be red yellow and green in different parts of your bom, your bill of material and it's and then what we need is how do we smooth this out?
 And that's what we get into with in a few minutes but just at a high level we all understood this to remind ourselves.
You have the demand driven operating model, which is at the operational level, the demand driven, which was at the tactical level, in the adaptive ..., which is at a strategic level.
So, business parameters come in from the strategic level into the tactical level.
You have your model configuration into your operational level, that then you look at your variants analysis coming back through.
And then you're looking back into your check.
So, again, from actual demand on the left to market driven innovation on the right, you're trying to find that balance.
And again, with the demand driven institute for this chart, they are certainly the experts in this area.
And so we move on into the second section, which is a data driven digital twin overview in the five levels that we talk about.
Organize, standardized, visualize, stabilized, and optimize, And traditionally, you know, going back 20, 30 years, this is the process that we all would follow, is how do we move through this process.
And what we'll show you is a way to do this, not in 2, 3, 5 years, but how to do it in an in 3 to 4, 3 to 4 months.
That's the big change that's happened. And why did they change? Because of data, Data is completely different today than it ever has been today in the past.
And this is typical of most companies as it were.
Most of the data is not trustworthy from a quality perspective. It's not integrated, and there's a lack of understanding. So can there be a platform to bring all this together? You just talked about ..., beautiful platform. These are all things that we need to do.
We need to do enterprise information management.
What can we do now?
All these things are 3, 5 year programs, and they're all things that we need to be doing, but what can we do now to change the workplace today, to help help everyone on the floor?
That's what we're going to talk about, So again, data, drives, information, drives knowledge, and then creates that intelligence, the ability to use artificial intelligence, We all talked about using AI, but if you don't have good data, and it's not believe and you cannot turn that into believable information, then you don't have knowledge.
Then, using AI on top is not going to be worthwhile.
So, if you talk to any AI scientists, what are they spend all their time on the first, this first bucket data, you have to get believable data so that the information is valuable to you. So you can use artificial intelligence.
So, number one, roadblock data in a recent webinar that we conducted, We asked the folks there, what the rank, their concerns.
And, again, readiness for digital transformation, everything we're just talking about, data, accessibility, and availability, then, of course, the ROI story.
So it always comes out on top, on every survey that we've done.
And that, which brings us to the digital twins that Osmium we'll get into in the next few minutes.
And, I'm just going to kick it off with this slide, that we put together, as this is the new process.
This is a new way of doing business, is, look at it with a visual trend.
Digitize it, Use supply demand, optimum shape optimization on stage three, and optimize the workplace, and then, create a sustainable process.
So, Hawes and has Inquiry to Soft as laid this out: where you, Your benefits, as you can see on the bottom, can range up to 12, or from baseline of 12%, up to 30%, year over year savings with a sustainable process. So now I'll turn it over to ..., and he'll walk you through how this is done with Create a Sauce Solution.
Thank you, Jim. And thank you, everyone for joining us.
Oh, me, share my screen here and continue on a digital twin journey.
So going from those points that Jim mentioned, you really have There are four types of Digital Twins, and now go into each one, um, And in detail.
So you can see how that transitions all the way to the actual data driven information that that would have.
So starting with the visual twin, this is going to be the initial representations.
That, that actually will have that's going to give you kind of view the matvey the visual of how the operation is going to work.
And then going from there, we're going to go into what we call our randomized and randomized when we will go into it. and a bit of detail.
That kind of builds up on the Visual Twin and allows you to create that what we, what today has been done, you know, pretty much on the simulation side and, and, and, and that type of section.
From there, we're going to go into the data driven.
And that's where we were going to concentrate quite a bit on a data driven, and how that data is actually going to help identify and help us run more efficiently on a day-to-day basis going forward.
Transitioning then into that learning, data driven twin, that is actually a shadow to end of the operation, and it's constantly integrated with everything else that you have within the system itself.
Going from the system to the worker as an 1, 1 continuous operation.
So if we look into each one, separately, look at the visual representation. And, again, these could be just purely visual of what that, when it's going to look like.
It's going to show you that, people are moving, it looks cool. It's great.
But it really doesn't give you any more than that. It's just a way to show you that this is how the operation is going to eventually look like.
It. The only benefit that you get out of that is, as you're building it.
And as you're putting that visual, you're kind of going through slightly over the processes to say, is there a better way to run it? Or, you know, that's what we're doing today.
-1.png?width=600&name=Event%20Email%20Graphic%20Virtual%20Conferences%20(17)-1.png) So you can just building that knowledge of all of these intricacies of what happens within the operation itself.
So you can just building that knowledge of all of these intricacies of what happens within the operation itself.
So it's it's very visual. It shows you the detail. You can show bottlenecks.
But there are really made up bottlenecks, because you're creating them from the visual aspect of it, only not from the actual analytical aspect of that one.
So it really has, no, I don't know, Analysis route, and you cannot didn't use any representation out of it, and it's really going to give you a basic representation. But that's what it ends. So, what we need to do is actually extend that and go more to the next phase where you actually do the randomized one and then the randomized when.
It's, there is a minimum requirement, operation that you would have, a, you actually will put in a random data on what actually happened within the operation.
Yeah, it just builds on that randomness that you have to kind of identify what potential issues that could exist within within the office within the operation itself.
It doesn't have all the visual constraints, but at the same time, it doesn't have all of the analysis that we need going forward.
So, from that point, it's really going to give you an overview of what the operation is going to look like.
So, you'll be able to see how kind of different systems interact, how different equipment anorak. It's gonna give you that idea of, you know, this is my boundary, I can, this has as fast as I can run today, or this is as long as I can run.
I can have, you know, 50 to 50 items in my weapon at any point in time, but these are just boundaries that kinda stay within those conditions.
Then you go into the iteration as as you create those. Those, as you.
Since it's based on that randomization of the beta, you actually will have to start running Monte Carlo simulations. And if you've done Monte Carlos, you know, back in the nineties and early 2000, Monte Carlo was, like the Holy Grail of Civilization has to be, but, he was doing it every time. You do.
know, simulation with randomization. You have to run the Monte Carlo to make sure that you're conforming. Now, this is a lot of things have changed since then.
and that's really what the transition we're going to do when we transition to that data driven model instead of the randomized model.
So, from a sample scenario, just to give you an example, this will apply to the warehouse.
It applied to the supply chain on the outside to outside the four walls inside the four walls and apply to any type of manufacturing, Whether it's a high mixed flow volume, high mix, high volume or anything in between.
The key is you need to know where your material are at any point in time, and you need to know if it's going to have any impact on your operation. So, if you want that, if, you know, a set of material to be at a specific station at a point in time.
You need to know where that material is and how it's going to transition.
That doesn't get there, Then you're creating inefficiencies within the operation.
So what we're doing there is kinda trying to figure out ways to eliminate that, and kind of give you that visibility into the operation and use that visibility to figure out how you can run better. And how you can optimize and improve the overall flow of the, of the system itself.
So that's also going to tie it into the people, right?
It's not just all about materials, but it can, it's going to go through the material handling process is going to go over the the actual process itself, and how the workers interact with the different systems.
So from there, you go into the analysis of a randomized win. And as you look at the.
As you look into the randomized results for from the twin.
You will realize that scheduling is an issue, you would realize that you don't have enough people, or you're not cross the your workforce is not cross trained.
Or, you know, different constraints there, but, you really cannot optimize that, because you're optimizing random data.
And optimizing random data is going to really not give you the results that you need.
So, even with a Monte Carlo analysis, you really get them to that 90% accuracy ratio, which is really where you want to be if you want to run that real time, and constantly adapting and figuring out what's actually going on within the system itself.
So, going from there, we kinda tie in into the data driven, data driven Digital Twin, which really is driven by your dataset, the key there is instead of putting in random data into the plan, you're actually feeding it data that you have within the operation itself.
Now, that's the transactional data that you're feeding in, doesn't have to come in from one place. You might have an ERP system that have some data, you will have an arc ELS system that's generating a different set of data.
You have a system that's running your material handling, that data, you've got your HR, that, has data, all that is coming together, and it's going to go into that digital Twin that is driven by that, by those different data sources that are coming in, and creating that view, that actual unit present, what's happening within the operation.
It's not making a randomized you, it's making an actual review, a true view of what that, what that data there, what that, what the operation looks like, and you can see it, basically on, on the virtual representation of that, through the Digital Twin.
.png?width=742&name=Screenshot%20(4).png) So a historical data, again, you know, it could be machines schedules. It should be your maintenance, depending on your operation. If you have a change. A lot of changeovers, if you have a lot of cleaning.
So a historical data, again, you know, it could be machines schedules. It should be your maintenance, depending on your operation. If you have a change. A lot of changeovers, if you have a lot of cleaning.
Or CIPS that you have to do on a on a, on a continuous flow type operation, but really what that's going to give you is a guide to what that cost to serve.
This Q is going to be within the operation itself.
And it's going to give you a way to get to that point in not just on the virtual implementation, but on the actual implementation on the flow by using the different optimization techniques that are in that set, that Digital Twin.
So, then, you start to achieve that relationship of, This is where I need to be, from a cost to serve perspective of the SKU, and this is where I'm at, and it's going to give you the steps to actually get to that point.
Now, the key is, if you stop there, and you risk actually going backward in that cost and that cost to serve this Q, going forward, your operation is dynamic. It's not a static implementation. Things change. You have seasonality. You have external conditions, as Jim mentioned, that actually impact the overall flow.
So, you cannot just use that as, say, I optimize today.
And I'm good, I'm just going to let it let it be for the next two years, and I will revisit that when the time comes.
The other thing is, if you don't tie it in to the actual workforce, and to the worker itself, then you're not creating that sustainability going, going forward.
So, they have to understand why that change is being made.
And they have to be driven by the actual system, perform that change.
So, you do actually get a lot more accurate results, from that trend, and from that data driven way. And the accuracy results from.
the other plus operations that we have done so far, is we're looking at 99% accuracy from a model perspective, from a digital twin analysis, and representation, whether and how it really represents current state, or how he's tracking forward, by analyzing future state, and how that plays out.
So I'm at 99% accuracy. I can say, I can really optimize this one. I can get real benefit out of the system.
And, and get that optimization that I need, going forward.
So, So it's from a benefit perspective.
You're going to get to all the detail on the data driven, when a lot of people are going to do value stream mapping and they will do, if it's taken time off, what the value stream is going to look like.
Well, if you, if you look at the data coming from the data driven twin, you can actually create a value stream mapping the value stream map that is as dynamic as your operation.
So your value stream will change, your efficiencies will change, your cost will change and you'll be able to see that live through time. And you'll be able to see how those impacts are actually going through.
Any, any operation changes, you'll be able to actually see it and analyze it to a high degree of accuracy going forward with that data driven twin, of course. Now, the only downside to this is it's not going to learn.
And it doesn't have that capability to actually touch the worker.
It doesn't have the ability to go back and tell the worker what to do, or what the next move is, or what kind of operation they perform.
All it'll do is it'll tell, you know, that in the people who are running at the site, the VISTAs, data driven.
And that's how you are, that's how your operation could improve and get to that, cost per serves, cost to serve this queue is.
So, from that point.
We go into, really, the main thing, the main topic, is, that's real-time, data driven.
And the real-time data driven, when, a lot of times could be viewed as just be, it could be a shadow twin, that's actually going to give you that representation of what's happening within the operation. And, it's also going to give you that real-time learning aspect of understanding what's happening within the operation.
And consensus, consistently, looking at ways to optimize and improve the overall system.
The key thing to it is everything in it is dynamic.
So if your, if your operation changes, the data driven learning, when is going to know about the changes in, it's going to start to create that impact And it'll start to actually transition the optimization toward that change.
So if you have if you have a scheduling system, for example, and You know that trucks didn't arrive at three AM The way they're supposed to they arrive at five AM.
So, the Scheduler, at that point, and the current system is going to be struggling to figure out how to make the systems work based on that delay.
Well, the learning data driven. when already understands how your operation works.
So it can take that Data change, which is the delay in arrival, and it will work it into the system, so you can have the actual optimized state automatically running your operation in real time, And that's the advantages of that of the real time going forward.
So you actually get into an implementation where you have the visuals, you have the ability to actually do analysis, because as you're, as it's collecting all that data, you can actually do a replay of anything that happened in the past. If I want to see what happened last week.
I can actually look at it at a high speed mode through my, through my through my data visualizer, and and see the animation of my operation.
Based on that, I can use that for offline analysis, and at the same time, I can use that to learn and understand how the actual operation will work going forward.
That's where those systems really become very empowered, and very, very powerful, and the way they operate.
So, really, the, the, the way, the kind of, connectivity point of view, and what has been done so far from a connectivity perspective, is, you've got your, you know, your, your, your systems that are running the operation, whether it's at sap, ERP W masses, or any other things that, you have, You have the equipment itself, that is the running based on PLC.
And you have controls that are actually being returned from that and some cases you might have some custom things that you would use.
Our TLS is huge.
Our TLS could mean static or active RFID tags. It could be GPS.
It could be beta coming in from your material handling system, identifying where you are automated guided vehicles are, and how they're actually progressing, and what the efficiencies that actually what their battery charge are. For example, at any point in time.
Of course, you tie into that. other systems that are tracking the different components that from the operational space you have.
As an example, you know, if you're if you're stacking your tooling, you can use the ...
system as a way that will track the tooling and then feed into that digital way.
And we'll help you identify, how, how you're utilizing your tooling and how to improve and maximize the cost of actually minimize the cost of running the operation, right.
Then you add to this, all of the, the natural way, or, you know, the actual motion of doing the task. Any repetitive task is going to have an efficiency that Relations with Time.
And you'll be able to see how that efficiency is actually going to degrade as you use more, you know, as the operation actually, regresses.
So, based on that, we actually feed, kind of, all of these different components enter the data as well.
You know, all the bond, the system constrain. It doesn't matter how detailed it is.
You actually need to get that data end, and that's going to be kind of the driver of what's going on.
Current state data that actually is a comparison between what the Digital Twin thinks it's happening today and what the Digital Twin actually is going to have, it's happening in real life, so that comparison is going to help it identify those variations and fine tune, the optimizer in order to identify those scheduled maintenance, for sure, sokol data.
People ask, how much historical data do I need, and there is really no limit on how much historical data you have.
The more you have, the better it's going to be, the better it's gonna learn.
The less you have, the longer time it'll pay to achieve that steady state of constantly providing improvement within the operation.
So, based on all of these components, you actually will get that, all the insights, all of the views of what's actually happening within the operation, and it will allow you to move forward.
And identifying those constraints.
So, the, historically that optimization has been happening about every 15 minutes, you can run it every minute. If you want, it depends on how dynamic the operation is.
In a warehouse, you probably will run it every hour.
It all depends.
If you have a highly, highly automated system, you know, then, you might, you might actually need to run it a bit faster in order to keep that operation going, but that's something that you can control from the controls on the system.
You can optimize your schedules, as I, as I mentioned, any delays. You would actually know ahead of time you kids can send you alerts.
People would ask, well, how would I know that I'm going to have a problem two hours from now?
And and it can be as obnoxious as you want it to be it can text your e-mail, you call you, uh, it will let you know if you only want to use one of those, then you can basically pick one of them.
The accuracy of the system is very high, It's using actual data, it's performing the same representation of your flow.
It's, it's, it's, it's it through representation of your operation, except in a digital form.
So, from that point, you really get to that 99.99% accuracy in the way that digital Lynn operates.
That's going to give you that extra confidence in the way it works, when you show it to your workers.
And when you and everybody who is going to be involved in the operation, they actually will see the operation running live, the way they see it, the way they see it in true environment.
So there is no question there of credibility to say, your digital twin is not running, Is not running my plant, or is not running the same way as the warehouse.
And the key to all this is, we actually use a, kind of, a set of neural networks, And the background, those neural networks are automatically learning from every symbol, datapoint that comes in.
And they are going to help in optimizing going forward, and providing a forecasting method, into what's going to happen into the operation. In the future, That's really the base of the optimization. There's a lot of optimization that actually happens within the operation itself, that's outside of the neural network.
But, really, that, the network is what's going to give you that AI capability to be able to see how things are going to change going forward, how you're going to keep them optimized.
Now, I did mention, it needs to touch the worker.
So, this is a kind of a sample screens that, that were set up on an actual implementation, where you can see, based on the operation itself, what the worker is doing.
And it's going to guide the worker. So, this is all real time. This has not something that happened 10 minutes ago.
Bas, the worker is actually going in and putting it powered on a rack location.
It's automatically telling them, You need to put this out and it's going to go at location, know, it, and after 20 17.
So that's an F 27 B now, is kind of a control point.
As the worker is moving around the warehouse, they will guide them to the location, and as they're going through when they hit when that, that the actual forks get close to that location. That bar is actually gonna turn green the site, that's what you need to go.
And then based on that, they will, they will unload the pallet, and as soon as the path is unloaded, there's a check to make sure that that actually happened.
And the worker doesn't get another task until that task is completed. And it's successfully completed, the way it needs to be.
So now, it's actually going down and guiding the worker into everything that they need to do, and then, going forward to the next step.
So, if they need to go on break, they just market that they're going to be on break, and they will not get additional missions. If they are not on breaking their working, it's going to tell them what the next mission, it, up to the person, to the driver to figure out what to do.
It's up to the system to tell them what's the most optimal move they need to do next in order to make the operation more efficient.
And that's really how it, it guides the overall operation.
Now, same, same environmental will happen with tool.
If you have your tooling operation of your tooling control, basically based on the wiser system, um, that's been wiser is going to go in and identify how much tooling you're going to use for each component.
That can feed into the Data Driven twin.
Now, you can track your consumables along with the, the rest of the operation and your cost to serve this, Q is now a bill.
And the consumables that you would use, and you can track that as reports to identify how well your consumables are being used, when do you need to re-order, re-order, and all the different components for that.
But the key for all this stuff to work, is you need to have the right workforce to actually make it do what you needed to do.
And that's where, actually, that predictive index allow you to get the true work environment and the true workforce to actually do what you need. And, Jim, you want to touch on the predictive index and how that applies? Sure. You know, No change management.
We always believe in people, process, data, and technology, so, we certainly would be a mess if we did not take into account the importance of people because, of course, if the frontline workers and management aren't aligned to this transformation, it's going to fail, and it won't sustain itself.
So, it's very important from the very beginning, is to understand the makeup of your people, who they are, what they want to do.
You know, and so for us, one of the best tools out there, being a change management expert for over 20 years, I've found that, you know, people really don't know who they are, may not know who they are, and what they want to be, and certainly, management.
Everybody has pre-conceived notions of who each, each other are. And one of the coolest tools out there today is called the predictive index.
And you can kind of click through these next four builds. And what they do is, you take a survey takes less than five minutes.
Go ahead and click parsing.
And it puts you through a set of questions and five minutes, and you will be assessed as to be a collaborator or promoter.
A maverick exploring in that right quadrant or you're stabilizer or an operator or Guardian or a Craftsman or you're producing scholars controller or strategies.
So these are all the personas that you have.
And then if you click one more time, there's some personas in the middle that are the flexors, the individualist altruist and after. There's no right or wrong here. It's just who you are.
And to get the job done at the beginning of the job, you may need more ex oring Thai people.
But in order to get it stabilized, you need people that are operators guardian's.
And the cool thing is, if everybody on the team, from the frontline, to the frontline management, to leadership, know who they are, we can, you know, cultivate these behavior.
natural behavior tries to center, drives your team around getting the job done and making sure that we have the right people at the right place to help enable this type of transition. This is a huge transition that we're talking about.
No, we can do it in three.
We can do it faster than the number one issue on speed.
Implementation is this.
It's not the technology. It's not just collecting the data either.
So, you've got people, process, data, technology.
The process is captured because we have the data, and we're like, how's he said, we're doing the end to end value streams in real time.
So we're, we're, We solve those problems. At the end of the day, it's always going to come down to people.
And understanding the people to make it work, so, ..., back to you.
Thank you, Jim.
So, going from that point, you actually will look at some of the data that you can do. And this data, you can customize this to any way you want.
That's kind of a sample that they pulled out from an existing system.
But that change, the key there is the data is not something that happened yesterday.
It's not your historical.
It's actually what's happening now within the operation, and how it's going to change going forward.
So, that's really the advantages there.
Now that they're big, the main thing about this whole setup is, you're actually able to go from zero to full implementation, and 3 to 4 months.
You don't need to wait three years to get it done. You can actually get it done very quickly and start to benefit from that.
The the one thing to keep in mind is if you stop right after the data driven to end, you don't do that transition to the real time, then there will be you will miss out on a lot of opportunities on actually getting that extra two to 5% benefit of going through the real-time optimization and maintaining the optimization that you've done.
It's more of a curve that if you stop optimizing, your data is going to change, your environment is going to change, and then your actual benefit will start to degrade through time.
So that real-time will make sure that it stays on an uptick curve all the way as you're going through the operation itself.
Yeah. And just to close it out, again.
We do have a roadmap proven roadmap of over 100 clients going through this process in this nine month program that we just laid out, that we really want to open it up for Q&A.
four Josey to come back and we'll try to take as many questions as we can.
Outstanding, Jim and outstanding Hosni. though, what a great masterclass on the latest when it comes to digital twins. So, I'm going to ask you because if you can stop showing your presentation screen so we can bring our cameras in bigger format for the audience.
You just go there, and that, yeah, hit that button, Well done, And, so, gentlemen, what, what, what great coverage on all these different stages. one of the first questions that I have here in discussions from the audience has to do with the stages themselves.
Are you suggesting that organizations, golf restage, want choose three all the way to five?
or you're suggesting that, actually, you can go directly to a different stage, maybe, Stage five, or is this more of an ascending process here to get there?
Yes, the key areas you have to start, you can start, if you already have some kind of a data driven Digital twin, then you can use that as a springboard. If you don't have that. Then the data driven Digital Twin is where to start.
That's really the main thing. You don't want to start on the visualization side.
You really want to start in a data driven digital twin, and you actually will start to see ROI an initial after the initial four weeks of the implementation and one once you do that.
And if I could just add, I think you can start as fast as you want to go, right? Housing.
But that's all right.
If your culture has to see before, if that's their crawl, you may have to look at it, do the visual first, because that's what your culture can handle.
It's on what your culture can handle, on what stages, and how fast you go through. It's really up to you and your organization.
I would, I would just, Yeah, add to that.
But you can start as fast as data driven.
What caused, and he said, Is that right?
Yep. That's exactly right.
So, when you're looking at your operations, what what does the target operation may be clients for you may look like someone who is maybe the best cases either from a uh, yeah operational dynamic standpoint and maybe from a culture perspective maturity perspective. Are you looking at high volume manufacturers' low volume, high cost manufacturers? What does the target client looks like for you?
Excellent question, and actually that target client is anyone who wants to run the operation better, It can apply to anybody, can apply it to the high makes that the law makes, it can apply to the warehouse small and big.
But the bottom line is, if you want to run more efficiently, then you have to go that route.
We can't anymore rely on just 1 or 2 people are running the operation.
We have to make sure it is self reliance and self. It runs, basically, independently of anybody touching any button.
And that's really what that real-time data driven. When will I get to?
So, again, if you want, if you want to improve, then, that's really the way to go.
It's also how far do you want to go? Do you want a totally automated warehouse where there's no people?
No. I mean, if you want that, we can build that. But if you want people in there, then they ROI is going to be different.
All right.
And the higher the, obviously, the ..., the more complex there are icons faster, But in a make to order environment, you can still gain gain a lot from using this tool.
So you're going to gain, no matter what, and with the ...
world, no.
Can you really afford to be slower than your nearest competitor?
You need to be faster than your nearest competitor. And this has got to ensure that you are.
What do you find to be the biggest barrier to implementing that, across? Did the clients that you have is, it is a technologist the data availability, it's just the people resisting new ways of thinking. What tends to be the biggest challenges for people who are embarking on this journey?
A lot of it is culture is just believing in that technology, and accepting it within the organization.
That's why they need to actually see it and believe it to go from beta driven to the real time. That's always a roadblock from that point.
Data available availability is another control. It's a lot of time controlled by IT. You cannot get access to the data, so that needs to be enabled.
Again, you know, the systems are reading data.
They're not writing data back, so, it's really has little impact on what's happening within the operation itself.
Those are kind of the key roadblocks.
Then, it goes, you know, from, know, that not not being able to spend the time to actually get that digital went up or running.
And we can also help with that.
And in those conditions, you could do this constantly right without disrupting production. So you don't have to.
I think that's really key.
Absolutely. Everything can be running in the way it is, and you can actually roll it out with zero downtime.
Yeah, there's so many aspects of what you have talked about here. There are incredibly valuable. Variable demand alone is something, the most operations are not set up to do well. And that's just one aspect of it. And as, as you know, very well, the issue of variable demand and supply has created all sorts of disruptions on current workflows. And, and, what you have here is you addressed the basics and you take it to very advanced levels of intelligence and cognitive approaches to, to optimizing flow.
There are leading approaches across the, across the Z industry. So, thank you so much for sharing this great presentation.
So much content and the end value here and, and thanks for leading the way on such an advanced digital transformation approach thanks for having us.
Thank you.
Ladies and gentlemen Jim, the reason Hosni Audra as I mentioned to the set for the setup of the session, this aren't great cross industry leaders and practitioners who are implementing meaningful digital transformations.
A lot of people will talk about Smart Factory and it's sounds good in a PowerPoint presentation, but it's really hard to implement. And when you are doing that type of implementation that love of digital transformation, you want to have leaders like Jim and Hosni behind you because they have done this for a few decades. And, they have the technical and the organizational capabilities to make something, this a reality, that some of the most advanced approaches for variable the demand and supply and optimizing of optimization of flow and value creation in your operations. So, terrific masterclass level presentation here did a very good job and really summarizing what is a very complex concepts. And, you know, 35, 40 minute talk here. So thank you Jim and thank you housing again for your industry leadership.
We're going to be taking a break now and then we'll come back. We are going to bring you another great industrial leader of culture, business and digital transformation.
So at the top of the hour we're going to meet Raj Shah got Galvan Apple pleased and surprised vice-president for Soft Software engineering at Wolters Kluwer and he's going to talk to us about the employee as a customer are professionals as customers and digital employee engagement.
So I'll see you with Roger at the top of the hour.
 Hosni Adra,
Director of Simulation and Process Improvement,
CreateASoft, Inc.
Partner & Director of Simulation and Process Improvement, Specialties: Process improvement implementations and Analysis through simulation. Lean transition planning, executive management, automation system design, system analytics, data collection, and visualization.
 Jim de Vries,
Managing Partner,
Enhance International Group.
Jim de Vries is a skilled thought leader with more than 30 years of experience helping clients achieve their desired outcomes through his ability to facilitate teams and drive improvement. His experience encompasses financial, commercial, CRM, services, IT, call centers, security, transportation, automotive, power systems, oil and gas, nuclear energy, research and development, government, and electronics industries.
-2.png)
-2.png)


.png)

.png "Access all 75 Award Finalist Entires")


