


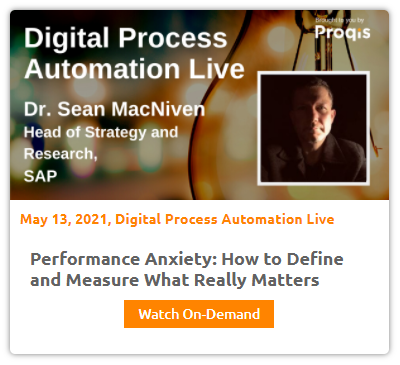
Courtesy of SAP's Dr. Sean MacNiven, below is a transcript of his speaking session on 'Performance Anxiety: How to Define and Measure What Really Matters' to Build a Thriving Enterprise that took place at Digital Process Automation Live.
![]()

Session Information:
Performance Anxiety: How to Define and Measure What Really Matters
We all learn that objectives should be SMART (Specific, Measurable, Achievable, Relevant and Time-bound), and yet we often find ourselves held accountable for metrics that are questionable in terms of their relevance or actual value, to be polite. And yet, no metric, as long as it is valid (measures what you think it measures) and reliable (can be reliably measured without bias or at least with bias accounted for) is inherently wrong…unless it is.
When reading “our new system to help increase self-service shows a 25% reduction in tickets logged as compared to the legacy system”, the statement raises more questions than it answers, especially if the system is running in parallel and allows users to choose freely which system to use. Is the system “causing” the drop, or differences in the users groups? These questions can be answered, robustly, and executives can be provided insights that are both accurate and actionable. Anything can be measured, if you really think about how to define exactly what you are trying to achieve.
This talk will provide insights into the following areas of organizational life:
Session Transcript:
He's coming directly from Germany to us to share his wisdom and expertise with our global community, and I'm talking about Sean .... Sean? Please do join us here. Shawn is the global lead for strategy and research for SAP's global product support organization with over 15 years of experience that S&P and as an independent consultant to organizations and government, including the European Commission.
Among the topics he leads, he's the chief architect of the support organization strategy of minimizing effort for employees and customers through the automation of insights and the digital augmentation of knowledge workers, subtopics of his expertise also include: The design of adaptive systems, gamification, measurement, research design, communications and P are impact, and social influence in online environments, and today he's going to be talking to us about Performance, Anxiety, how to define and measure, what really matters. Sean, this is a fascinating topic, on behalf of our global community, are very thankful for you to share your wisdom and expertise with us today.
Thanks, a lot of GSA.
So, to get started, let me just share my screen.
We can see that, hopefully, I'll put my self away, so I can't see myself.
Yeah, so thank you, Thank you, for that shows AI. I sound a lot more impressive than I probably am.
Performance anxiety, something that, that we often deal with in the, in the enterprise, and the topic of measurement, so I'd like to just get started with that, with a question for you.
So before it, before I skew any of your results.
I'd just like to ask you in general, do you think that the metrics you are measured by, it makes sense.
And just say, you can just run that poll now, very briefly to get a sense of where people feel they're at in their organizations.
That would be very helpful.
And I just launched the poll, Shawn. So for all of those attending, please go ahead and take your votes. Do you think the Matrix, Your measure by makes sense? It's a simple yes or no. So choose one of those two options. Go ahead and vote now. And I'm going to be watching your voting coming in here.
Take your votes. Do you think the matrix, your measure by, makes sense? Go ahead and vote. Yes or no. Do they make sense to you?
Yes or no. I'm seeing your votes come in, and we have about a third of the votes. And we're approaching a half of the votes and good job, everyone.
Keep going. Keep going. This is an interesting audience. Business transformation, operational excellence leaders. I'm curious to see if you feel that the metrics to measure by makes sense. All right, I'm going to cap it now for those who voted. Thank you very much. I'm closing here.
And Sean, I'm going to share the results of the poll now. And while we had, Sean, is that six or 7% of the people said yes. They think it makes sense, but 33% said, now, it doesn't make sense.
Interesting, interesting. I kind of expected a bit of a 50 50, but that's, that's very interesting, maybe that's a good sign as well.
But thank you for that. That's really just to sort of set the scene for the overall topic that we're looking at and some of the challenges faced.
So the agenda for today is to talk about just going through a couple of examples of meaningless metrics.
Then the human factor of why, why we may, you know, adhere to metrics or set metrics that don't necessarily make sense, will make decisions that don't necessarily make sense.
Then when KPIs are not necessarily the right metric to use, the topic of framing failure as something positive.
And then just a couple of steps towards meaningful measurement.
So without further ado, we'll start off with some meaningless metrics.
Now, if you're in the marketing communications area, one of those will be hits, and I like this. And for many years, I worked in the communications department of S&P and lead innovation for that comment.
 And when I, when I joined this, they're always talking about hits and views, and page views, and all the rest, and I encountered the acronym, That hits actually means how idiot's track success.
So, the problem with, with hits and the similarly related topic of impressions now with social media, which is even less tangible than hits in the sense that impressions don't even measure actual clicks, they actually they just measure potential clicks. So someone may have seen or you know, may have viewed your content.
This this insanity about these, These, these, these metrics is that they are big metrics, and they seem to be impressive, and very, very easy to capture.
But they don't actually translate directly to impact, unless the sheer number of hits is your impact metric.
But it really is, they can be a sense of give you a sense of scale, but that's about the extent of it.
Another one is adoption.
So, platform adoption. Now, adoption itself is not a meaningless metric.
But the way it's often measured, you know, is very frequently quite meaningless.
The number of times that people log into a system, like with any metric, you need to really go into more detail about, is that the amount of time that they're spending? What are they actually clicking through? What does the customer journey, or the engineer journey, or whatever it happens to be your target audience? What are they doing within that time in the adoption?
Is not just a matter of that they use the system on occasions you have to go a lot further into it Adoption is one of these things you'll see later on, one of my SAPA examples that can really lead to the wrong incentives as well Another similarly related topic is activity.
And again, activity, whether it's clicks or views or, you know, ratings of content or whatever it happens to be.
Was the coasts engaged in that connects to engagement as well?
In itself, nice to know, but not necessarily connected to impact.
And that's what we often struggle with is that we have these metrics and adoption that activity and hits but they they are completely liberated from any connection to actual business impact.
This also goes to the academic world as well, where the number of citations is a big, a big factor about the extent to which a journal article.
Or even any piece of published research is viewed as, as positive or impactful since the number of times it other people have cited it.
And to the extent that it goes to the so-called Impact Factor, which has almost terrorized, the Academic World, because the Impact Factor. If your University has a high impact factor in terms of the published research, you're more likely to get government funding and all the rest.
And yet the impact factor itself has been heavily criticized by researchers because of its skew. And also it doesn't look at the quality of the source of citations.
Good journals tend to have high number of citations, but it's a poor indicator of the individual quality of the papers published in those journals.
And some some, you know, some some open-source publications are just as good as science or nature or sell or any of the really top journals in terms of the quality of the individual publication's themselves.
So again, metrics that can be quite meaningless but can have a major impact, negative impact.
7:23Within the support wells. And this is this is what I was kind of alluding to before another, another topic is also helping with deflection.
 So deflection is basically any kind of technology or tactics or processes that enable you to not have to have a customer engage with your support staff.
And it's not because we don't like our customers, but it's because ideally we'd like our customers to solve the problem themselves because that's the lowest time to resolution.
And is most likely going to be the highest satisfaction levels for them And the lowest amount of effort if they can just find a solution very, very quickly and never have to engage with support style.
But again, how you measure deflection is not really standardized across the industry.
And I recently presented that the TSIA, Technology and Service Industry Association, around the same topic, and having engaged with some of their experts across the consortium.
The topic of deflection is not, is not well defined anywhere by any company. And yet, it's one of the most fundamental metrics that a support organization is measured by.
So we, Fred time at sap, We had had the metric off like this 1050 slogan. You know, it's always good to have slogans when you're in a corporation.
So we had this 1050, 2020 goal of reducing ticket volume by 50%. And that literally meant the number of tickets reducing them by 50%.
But, when you actually then, look at the distribution, in terms of the time it takes, and this is taken from a sample of 350,000 tickets that I, that I analyzed specifically for this talk here.
The solve ton of the lower 50% of tickets, in terms of the number of days it takes to solve tickets versus the upper group.
Basically, when you divide it that way, if you take the lower 50%, you're only deflecting or reducing or minimizing effort by around 4% for your organization.
Because the upper 50% of tickets take up 96% of the time.
It's like the Pareto principle, the 80 20 principle, but even worse, this is a 496 principle.
So the easiest 50% of tickets represent 4% of the total effort.
Poor metric, if you're incentivizing people and giving the impression that we've now reduced ticket volume by 50% now, you haven't you've reduced it by 4%.
This is an example then of the low hanging fruit, as well.
We often talk about that, and we'll often choose metrics, because they may be easily accessible, Maybe we have them in the database already. Another big challenge and corporations of any size, I guess, is, is obtaining accurate data.
Especially if you have a larger organization or complex IT landscape, and you're going to have many systems that may be storing data in slightly different ways, that lead to translation issues and harmonization issues when you bring the data together. And, you know, we've struggled with this a great deal, especially leading, leading research topics for sap.
It's the amount of effort you need to invest just to get the right data. It can be. It can be prohibitive at times.
The problem with low hanging fruit is that you often get in a little more than you bargained for. And the low hanging fruit is also, you know, the most likely to fall to the ground.
I actually calculated this 500% extra protein because the average earthworm and I know that earthworms don't eat fruit. But I mean, that's an apples.
But the average earthworm has about 1.9 grams of protein, which is around six times higher than the amount of protein in an Apple trivia.
So this is nicely summarized by the topic of Campbell's Law, and I'll paraphrase this and paraphrase many times.
But basically, when you take a simple indicator, any kind of quantitative indicator, and you make that the foundation for your decisions, it becomes less and less reliable as an indicator.
It seems it seems kind of challenging in that sense that you have, you have this indicator, you're trying to use it.
But you're actually inspiring certain behaviors around it. And one of them is that people will try to game the system.
So if there is a metric and I have to meet that metric, then I'm going to do everything in my power to game that system. Or I'll simply adjust my behaviors to match what is expected of me, irrespective of whether that metric actually makes sense, and it's actually connected to the corporate impact.
So that leads us then to the human factor, yes, you and me, and all of us here, And that will lead us to another poll, as well, the poll is, are you a better than average driver?
There's a, if you could run that poll, this would be interesting to see.
This will be interesting to see if this audience are you better than an average driver, so I'm launching the poll right now, and you should be seeing that come up momentarily. So please go ahead and vote. You have two options here, are you better than an average driver? Yes or no. Click one of those two options, and I'm gonna wait for your votes to come in.
So, please go ahead and vote. You better than an average driver taker votes. I monetize, we almost have to come in.
So, a few votes coming in already. We have 40% of you voting right now.
Keep going. Let's see what it looks like, keep going. I'm gonna give you five more seconds to make up your mind here. Are you better than the average driver or not?
-2.png?width=600&name=Email%20Graphic%20Virtual%20Conferences%20(1)-2.png) So, I'm gonna close it now and I'm going to share the results with everybody and know what do you know pareto's law again prevails? 80% of us thinks that we're better than the average driver. And that is supported by research.
So, I'm gonna close it now and I'm going to share the results with everybody and know what do you know pareto's law again prevails? 80% of us thinks that we're better than the average driver. And that is supported by research.
Now, probably we have a global audience here, but already, around 40 years ago, or 40 years this, this year, actually, anniversary, a study was run run in the US and Sweden that found that 93% of the US audience and 69% of the Swedish audience put themselves in the top 50%.
So this may seem like an example of overconfidence how is it possible that no 80% of us can be better can be in the top 50%, obviously it doesn't. It doesn't really make sense. From a logical rationality perspective.
Interestingly, it does make sense from an ecologically rational perspective, because ecologically, most drivers are better than average.
And it's probably around 80 to 90% it better than average, because it's negatively skewed.
So what you actually do have is that there are some really, really bad drivers, and they, they skew to the left. And probably 70 to 80% are better than average, but obviously not better than median. And when people think of this, they typically think of themselves in the median perspective, but it is an example also of overconfidence.
that is, that is one of the big challenges that we're facing organizations and in life in general, when, when making decisions, especially as we start to deal with leaders or decision making isn't executives.
And this can be reinforced. The more experience you have and the more successes you have than the more likely you are to think that your decisions are going to be correct.
And then we have also the Dunning kruger Effect, one of my favorites, which is basically the less you know the more competent you are.
I think we've seen a lot of this in many of the conversations since 20 16 with with Brexit and the US. Elections.
A lot of conversations have happened on both sides where we've found the Dunning Kruger Effect very effective effective.
So I have another question for you.
And that is, which city has more inhabitants in Geneva often don't. However it's pronounced, Any switch.
Swiss people can correct me.
They'll say, could you run this poll now quickly?
And thank you guys.
So I'm actually launching, You're in right now, which city has the most inhabitants, Geneva or thon. Please take one of you all, take a vote here, 1 of 2 options here. The poll is now open.
vote for the city that has the most inhabitants in your opinion, choose one out of the two.
Don't overthink this, just go with what you know, which city has the most inhabitants waiting for the votes to come in.
They are coming in.
Um, very well.
keep going, well done.
We have adults come in and.
And the way I have it right now, I'm closing right now and I'm sharing the results.
And while we have is that Geneva has 53% of the votes, for most inhabitants, Suntan has 47%, Sean, yes, thank you for that.
I think I think that the topic of cognitive biases and overconfidence is probably skewed this somewhat, which I expected.
But actually, Geneva does have more inhabitants, and it's many, many, many more inhabitants.
And this is an example of that take the best heuristic.
So, it's not always biased is that the bias is a negative, or the way that we think is not always negative, It really depends on the context in which we're thinking and the context in which we have to make our decisions.
But take the best heuristic, which also includes less, is more, Sometimes knowing less about a particular topic, makes you more accurate.
Recognition heuristic is this here, most people recognize the name Geneva, but don't recognize the name, ....
And it's, it's another example of one reason decision making.
It's been very effective with predicting elections based on single topics, the size of sporting organizations, et cetera.
And, in fact, as a, as I stated here, and there's the research you can see here, as well.
It often outperforms even machine learning methods like logistic regression and various classification algorithms.
But, at the same time, it is closely related to what's known as the availability heuristic.
And that can lead to other types of biases as well, in the sense that, if you've heard of something before, then you're more likely to give it more weight than if you have not heard of it before. And this, this applies to anything that's happening in the media.
So what the Media Reports, or your social media feeds report, it's, it's, you know, top of mind, basically. And it's going to have an influence, is going to bias your decisions. And so you may be the person that knows the true truth as compared to the fake truth.
So what's actually going on in the world, as compared to what we hear and what's reported?
And then with the availability heuristic.
And a final poll for you.
And I'll just read this out.
And then ask GSA to run the poll, Steve is very shy and withdrawn. Invariably helpful. But with very little interest in people or in the world of reality.
Make untidy soul, he has a need for order and structure.
And the passion of the detail, is Steve more likely to be a librarian or farmer?
Just say if you can run that poll, that would be great.
So the poll is getting launched right now is Steve, a farmer or a librarian. So please vote for one of the two options, farmer or a librarian.
.png?width=742&name=Screenshot%20(4).png) Waiting for your votes to come in. Go ahead and take your votes. Is Steve a farmer or a librarian based on the description that you had, that you have just seen.
Waiting for your votes to come in. Go ahead and take your votes. Is Steve a farmer or a librarian based on the description that you had, that you have just seen.
Go ahead and votes very well.
First few votes are starting to come in, well done, coupon voting.
I'll give you another NaN or so to cast your vote.
And, uh, coming in, coming in, coming in, well done, I'm going to close at this point, right.
And the results are 56%. Think this. Steve is a farmer, and 44% thinks he's a library.
Hmm.
Interesting.
So, the, the point would be, now, what your reason for choosing one or the other is, because the results are such that.
There are 55 times more male farmers in the US alone, than there are male librarians.
So based purely on the statistics, the probability of steep being a farmer, irrespective of any descriptions of Steve's nature, is that is the base. The base rate is 55 times higher than him being a male librarian. And if that's the reason that you chose pharma, then congratulations, you're probably in the top 1% of the world for making the getting that right for the right reason.
If you are basing it on, well, you know, maybe shown is asking me this question. It's a trick question. So, I'm gonna go counter-intuitively, sounds like a librarian, but that can't be right.
That would be the correct answer but the wrong reason.
And vice versa, if you chose the aspect of of personality being a librarian, you know, any any argument, other than the statistical probability itself, would probably have been the wrong reason to choose one or the other.
In any case, this is known as the base rate fallacy and it's that, when we're making decisions, we often, fail to take into account the, the, the, the fundamental probability of a given situation.
You look at any sort of Bayesian theory's, et cetera.
Bayes Law states that very clearly you're constantly updating your probabilities but you need to have that initial fundamental probability to start with.
So congrats to anyone that got that right for the right reason.
I, by the way, was not among those people when I encountered that question.
I think I chose Fama but for the wrong reasons.
Another aspect that we often encounter is the anchoring effect, and that basically is that whatever number we hear first tends to stick in our minds more frequently, and have have more weight.
So I can't, I would have run. This is a poll.
But I can't, because I need to run it with two separate groups and give you both, you know, both groups, two separate numbers, and then ask you to estimate.
But, if we look at this very simple one from conman here, that when two groups who are asked to estimate the number, the sum of one times, 2 times 3 times 4 times 5 to 8, and the other half got eight times, 7 times 6, et cetera, to one.
The estimate for the lower was 512 and the estimate for the higher 1 was 2250, and the correct answer was 40,320, so much higher again.
But, it clearly shows that the anchoring effect is powerful.
And the other aspect of the anchoring effect is that it's extremely difficult to de bias.
It's so fundamental that even when given monetary remuneration people and they know that they're being anchored, we struggle as humans to deal with the anchoring effect so a very, very insidious and pervasive bias that will skew in any of our decisions.
The other is a framing effect, as well, is that, depending on whether you, say, 1% fat or 99% fat free, will have a major impact on, on your purchasing behaviors as well. So the way that we frame numbers makes a huge difference.
A lot of research has been done into, but medical decisions.
And that was also in one of the courses I took, you know, saying that, a, you have a 10% chance of, of dying, versus a 90% chance of living will skew the people and patients decisions about given treatments.
And the one that relates to the farmer question is the outcome bias. And this is a really, really powerful one.
It's really, the one that I've, I've worked the most against, I guess, or de biasing within my own company of Sappy is that we often think about the results of a given project rather than the process that led us to those results.
So, that's the question with the pharma, Did you choose pharma? Of those, 47%, did you choose it for the right reason?
Because, if not, you might think, Yeah, I got that right, you know, Pat on the shoulder, and the next time you're faced with such a question, you'll use the same ... and the same strategy. And next time, it might not work out.
So this is a process about really understanding why we make certain decisions, is very fundamental to how we set metrics and measurement.
And another one is the confirmation bias.
I drew this comic when I was actually doing my doctoral work, so it was inspired by the research world.
We're not sure whether the data would support a hypothesis until we remove the outliers.
We look for information that confirms our existing beliefs, and we do it mostly unconsciously.
You know, we're happy to hear something Like the availability or It's like, Oh, I've heard that before. And so, I probably, it must be correct, because I've heard it before.
That confirms my existing beliefs, so it's probably correct and we'll have a bias and tend to favor those those types of information that confirm our existing biases.
And to summarize that, you know, there's a fantastic document here called The Cognitive Bias Codex, I highly recommend you downloaded. There's a, there's an SVG file of it so you can, you can print it out and pin it to your will. You can make it your wall to remind you if you'd like.
I've been thinking about doing that. Actually, they tried to capture pretty much every bias There, isn't that group that beautifully.
But what this all tells us is that basically, you know, we are fundamentally human and biased, we can devise some of these aspects. So motivational biases, advisors that were motivated to hold because we committed to something passed with committed to a project deadline or whatever else.
This can be biased by, basically asking people to calculate more spend more time thinking about the problems or to hold them accountable for it.
The Cognitive biases that we saw before with the with the codecs, there are so many different techniques even anchoring can be, can be, you know, have its its effect minimized.
With re anchoring techniques and overconfidence there are many strategies for minimizing the negative impacts of the competence. Such as just considering the opposite scenario, or running what's called a client's Pre-mortem. Where you basically, before you run a project, you think about all the reasons why it's failed.
So you imagine that it's failed and the thing, and then you work through all the reasons why it failed and then make sure that those things don't happen when you actually run the project.
It's a very powerful technique as well.
These are both limited in the sense that they're typically individual devising techniques. There are technologies.
We present that in this conference, but I'm actually building a massive choice architecture platform, basically, within sap equal support to enable engineers support engineers, too. To de bias through the system itself. So basically, making it easy to make the right decisions.
But that's for another another talk, Babs.
So in summary, we're programmed to cut corners and use shortcuts to minimize our cognitive effort.
The good news is that we can be reprogrammed and we can reprogram ourselves.
So that leads now to the topic of KPIs and why that's sometimes the wrong metric.
They have a long illustrious history.
I won't go into it too much because, you know what KPIs on, number of new contracts, et cetera, you know, often, they're lagging indicators that we're looking at rather than leading indicators.
But it can be both.
The KPIs have a good history as well in sales. And they work very well there, and I know that when I was working in communications, we had KPIs, but it didn't make sense for communications.
And one of the reasons for this is, for supporting functions, is that you're typically looking at the elimination of risk rather than reward.
So, some examples might be, that we used in communications or adoption rates, engagement of employees, employee feedback, retention and turnover, well, my interaction and viewership, customer satisfaction and sales, collaborations and innovation.
All of these, in a complex matrix, in their own right, to measure that, But collaborations, I've got an entire program running to, to develop something, looking at network theory.
These these are complex metrics that can be measured, but they're not not easy. But what I typically found in my time in communications was the biggest indicator of success, was the absence of escalations.
And, that really got me thinking about, what I called at the time, ..., or key failure indicators. And I later redefined as ... key risk indicators, because that's what I actually found in the literature to be the actual term for what I thought I had invented.
So, I'll call them ..., but, in any case, the absence of, of negative effects, it's often the metric that you're looking at.
So, that leads us to that topic of K arise. And like KPIs. These are measurable.
They are looking at the, you know, loss resulting from inadequate or failed internal processes, people, and systems, or external events. I mean, that's really, really the heart of it. And if we're in any kind of supporting function, we're going to be looking predominantly at at key risk indicators like KPIs. They need to be measurable, predictable, comparable, and informational, as well.
one K arrive from the support world has been to delight customers. Our KPI has been to delight customers.
But as already over 10 years ago, Harvard Business Review publicly published this article, stop trying to delight your customers.
Because out of 75,000 people they interviewed, all customers really want is a simple, quick solution to the problem.
They're not interested in being delighted, if they're not interested in this KPI type mindset.
They want the absence of interactions with support.
So ultimately, a customer interacting with support at all is a key risk indicator.
And this has led us to create a new slogan of, Minimize Effort Always.
And there's a whole philosophy around that as well, because minimization is a process as compared to outcome biases where delight is an ephemeral state.
Minimizing effort is actually something that it continues forever. It's the process of optimization is continuous.
You never actually achieve like, a perfect optimization.
As the situations change so too, it will it.
So it's a leading indicator in the sense of of being closely connected to operational efficiency, satisfaction and loyalty.
And once you begin to optimize it, it is effective achy, OK are on its own right.
You can then monitor that and flag it as the stats change, then you might need to action it.
And the key aspect here is that, you know, you need to evaluate your objectives and ask yourself, Is it really a KPI? Typo there. Sorry about that. Rather than a ...
for supporting functions terrorized may be a much better approach.
My goodness, so many typos in that one.
Framing failure. So I'm going to frame that type ofelia, as that was completely intentional. Just checking if people are actually still awake.
Here's the mysterious case of the efficiency of a new support process.
So sometime ago, we implemented a new approach for customers to log ticket's called the support system, and it's effectively a wizard. An incident wizard, if you like, our case, was it.
And in comparison, we have the standard form where you have to fill out all of the individual details.
As compared to having a Wizard basically ask you, at each step of the way and providing you with information along the way that may help to deflect your help you to self self's, solve your problem, basically.
But after a year of it running, there was still no evidence of whether it was really successful or not, and the adoption was flagging. It was lagging, basically, in the adoption of inset was a metric.
So, in framing this particular situation, I had to really think about, well, what, what are the fundamental biases that may or may be at play in this particular project, and they really were over competence and outcome bias.
So, looking at ways to de bias, those are those two in particular, one is to move away from focusing on the out the outcome of the adoption rates and focus on the process of adoption itself.
What leads to adoption, what are the leading indicators of adoption rather than adoption itself and how might we be overconfident?
Of course, we were all convinced that this could be a great tool and could be helpful, but I will be overconfident, what was that based on.
So, the adoption metric had been set at 25% within the 2022 frame timeframe, and there was no real research to found to sort of back that up at the time.
So, it would not have been a robust decision, even if we had succeeded or failed, it would not have been based on any actual process in terms of the actual measurement.
And an initial review of the observational data showed that the results were mixed, in terms of customer time to resolution, and the number of component changes in the complexity, etcetera.
So I suggested that we run a randomized controlled trial, which is a gold standard, if you'd like, in the medical world.
And basically, the Germans have an expression here of, but if the cloud is good control that is best, or basically trust is good, control is better. In this case, randomized control is better.
Where you basically, you AB test, effectively. An a B test is that type of randomized controlled trial.
It's the language used in the business world, but you basically assign it to two separate groups and you randomize it so that you effectively have the statistical equivalent of two identical people that you're, that you're running the treatment with.
The reason for RCTs is simple, is that we often base decisions on observational data without knowing whether it's actually causal or not, is correlational. The example here is my gamification platform that I launched.
We had some really good statistics suggesting that the ratio of interactions, for those people that use the gamification system, they were twice as active in all of the other systems we were measuring, than those that did not use it.
And the initial thought might be well, it's a gamification works. It really does lead to higher levels of activity.
But that would have been wrong because that's not a causal statement we could make because the groups would've been different.
In fact, more likely is, and also subsequent researchers shown, that people that tend to use gamification also tend to be more active in general. So it's more about, the, to the differences in the groups, rather than necessarily the process itself.
And that's why you need to randomize, So that's what we did with this particular situation here, is that we ran this, randomize the groups and then looked at the different effects for each of those.
And what we found was that indeed, conversion now, as a type of deflection, basically, a session is logged, it converts to a ticket, or it does not convert to a ticket.
Was, was, you know, markedly different is that those using the support assistant in blue?
On average logs, 50 to 50, 2% of time logged a ticket from this session, as compared to 78% of the time from the, from the standard incident form.
This was a proper randomized control the groups were effectively comparable, so it was not based on group differences. And we control the different products where it ranged in some cases it was over 30% higher. In some cases, it was eight to 10%. But on average, we had this 26% difference.
So, normally, with a robust approach, you go like, well, let's go celebrate, roll this out, make it mandatory, et cetera.
But we can't, because it raises more questions than it answers in many respects.
We couldn't poll the customers because of technology at the time, as to why they didn't lowercase, and this is also GDPR and data protection. And that's very, very complex. Sometimes, it's just difficult to get the information you really need to improve the customer experience.
So, the reasons for the differences can't be company apulia inferred from that alone.
We know that there isn't a effect when people have no choice, but to use one or the other, that they log fewer tickets, But we don't know exactly why.
And so, that has led to additional research.
But what it does is, it shows that, you know, the decision process, when robust, enables you to make, to distance yourself as a decision maker from, from the results, be they positive or negative.
Explanatory or not, if you have the transparency to say, I know why this decision has been made, and I can, I can state that failure is not really so important anymore. You shift yourself away from the outcome bias aspects of the topic.
And that really is summarized here, is that we want to move away from looking at our target specifically, and shift our focus to the process of what it takes to get there, Which can be very, very complex, but by doing that, we effectively liberate ourselves from the anxiety of performance itself.
So, I'm wrapping up now. I think what we'll have time for, for, for talk now.
Smart, Smart plus, o.k.r.s, most of you will have heard of smart, specific, measurable, achievable, realistic, and timely time bound is that when you think of your objectives, that you really defined them in that way. The other aspect is that you should make sure that any objective is closely connected to some top, top level organizational objectives.
And then you use these as leading indicators of that, of that lagging indicator at the highest level, and then, o.k.r.s, of course, you know, Objectives and key results have been used as well.
Now, this may sound like it's an objective focus again, but when you're looking at the process of making decisions about these objectives, that's the important aspect.
You can have metrics, and you can have objectives, and you can have, in a simplistic numbers, as long as you can clearly, and transparently argue for why you've chosen those numbers, then you really can't go wrong.
And another point before we wrap it up, one more slide following. This is the illusion of intangibles.
People often talk about specific things like employee sentiment, engagement, etcetera, as being intangible, and a lot of the really important metrics in the business just can't be captured.
But that's an absolute illusion, Anything that exists anything that exists can be measured And you can find ways of doing so.
Also with data, why while intangibles typically are measured with survey data, you can actually take take the equivalent of it and match it to your operational data and then start to use behaviors as your predictors as you're leading indicators of those in those units, so-called intangibles.
You'd have to do it in a case by case basis. And, obviously, that's all the time in this presentation to do so. But there is a process for taking any intangible, even intention, and sentiment, et cetera, and finding other indicators of it within within your data, if you're collecting enough behavioral data.
And remembering as well that behaviors are far more powerful indicator than what people say about their behaviors, where you always have the issues of self report, self selection biases, and all the other problems that go along with survey methodologies.
So, to wrap it up towards meaningful measurement, an initial roadmap is to really ask, what you're trying to do.
Really, really, what are you trying to do with a given project or a given decision?
And once you've really clear about that, what does success look like?
And don't even think about the lower Level metrics potential, leading indicators of all of that success. What does success look like?
Is it that customers are now recommending you to other customers, and you're increasing, know, your overall customer base through that, Whatever happens to be, you need to know what success really looks like for your project.
Once you can really define that, you need to also ask, what does failure look like?
And, to really, I would highly recommend that you run the equivalent of a pre-mortem.
Climes pre-mortem is called, it's a very powerful technique for any kind of project management with decision making that you might be engaged with.
And then, once you've got that, how will you know your efforts lead to success?
And that's really, then, developing the indicators of those success metrics, and really understanding how you led to those results, What it was there, a causal link.
Or like with the communications examples. You know, we have positively impacted loyalty, or how I had never met a communications professional, or consult the communications department, that was doing that robustly, and could clearly, and causally show how their efforts, their articles, the sentiment of their articles, was directly connected to any top organizational goals.
Now, you may not even need that in your business, because most people don't, actually.
But if we strive towards that, we're going to have a lot better metrics in the future.
We're going to have a clear understanding and transparency around the process that leads to decisions, and leads to the definition of those metrics, and that, ultimately, is going to almost entirely eliminate any anxiety around communicating success or failure within your organization.
And on that note, we have a little bit of time left, but it's OK to be wrong if your processes, right?
Thank you for your time, and I'll hand it over to GSA for Q and A.
Sean, how many hours do you have? four minutes here? But, you know, you have opened Pandora's Box of Marion, An observation that if this crowd, I mean we have like probably hundreds of Lean six Sigma Master Black Belt saying here and that, you know, who are just loving everything about what you're talking about, I'm gonna bring my camera on.
And I ask that you stop showing your screen, your presentation screen, so that they can see you in the bigger camera right now, and that's fantastic. So we have reduced time here, at this, this, this, this audience is so sophisticated, that I'm gonna pose every question, but first, I'll open up a quote, because they provided, that was the first as well.
So the first one comes from, from Edward Deming, and the quote is, In God, we trust all others, bring data, and, uh, and, uh, tell us the question comes from William Fuller? And within the same, based on your analysis of methods for collaborative decision making. And I would just suggest that type one, thinking, or type, just thinking is preferable for decision making from, you know, he is alluding to the book from Daniel and I'm sure you know about that.
So, what does your thoughts about bringing this? What do you discuss here to the, to the framework of type one and Type two thinking.
Yeah.
So, what I'm trying to do in the organization is to combine the two is to translate type to thinking data into the equivalent of Type one thinking: heuristics and processes.
So, basically, you want to minimize the effort for your decision makers, but you need a high level of cognition for many decisions, especially in business.
So, you type to, you know, thinking slow processes are necessary to process that data.
But what if we can automate the generation of insights?
And that's what we're looking at, is, how can we build systems that take the complex type to, you know, think thinking system, and generate a level of communications design that makes it possible for the decision maker to quickly understand what the problem is, through informational architecture, design, choice architecture, What it actually looks like. And then they can make that decision very easily with minimal effort and minimal stress.
And you have that sort of decision making matrix, basically, your process goals, as well.
That's from the adaptive decision maker.
I have it cited somewhere else, but basically adaptive decision maker and process goals to increase accuracy, increase transparency, or minimize effort, and minimize stress for the decision maker.
And depending on what that is, but actually, we can do all of them. We can minimize stress and and effort for the individual by automating the process of the insight generation, and then augmenting the individuals with that.
So both thinking slow, and thinking fast, it's not the one is better than the other. But the problem is, when they're not used in the correct context, when you should be thinking more about a process, but you're not.
And it's not always easy to know how to do that. That's the other problem.
So that's why we need technological de biasing. We need to build systems that just make it easy for people to make the right decisions.
Powerful, powerful, Powerful Insights, Shawn. So, we have time for maybe one more here. And the quote is, from all the way back to the 19 thirties, great. Statistician Walter Shoe Hard and Walter Shoe Heart likes to talk about. You know, Data apart from its context is meaningless. And you've talked about this. You've talked about the importance of the data, but you also talk about the importance of observing behaviors associated with that data. So, if you can discuss a little bit more about that, that the need for measurement. If look, that more broadly is not just the hard data, but also the behaviors that give you insight on how that data is collected. Any other thoughts on that?
Yeah, I mean, that's, that's the whole that's at the heart of automation, really. And that's, you know, that's what this entire conference was about, really.
It's digital process automation.
But the automation serves the augmentation of the decision maker in my world and, in my worldview, we automate in order to augment.
And so, any automation has to be well thought out, to begin with.
And the human, You know, the human input, the system two thinking has to be there to begin with, to make sure that the automation makes sense, and that we're simplifying things that humans can't do better.
Machines can do certain things better than humans, but humans have better other things. We shouldn't waste time trying to improve the human experience in terms of doing something a human can do better, but maybe crowdsourcing might be a better approach, Or getting a panel of experts together.
You know, we still, we still are the leading species on the planet for a few more years.
So the process is absolutely the data alone, as no, has no no fundamental value, until you start to make sense, but in aggregate it. But that is the process, better analysis itself.
Data science, it's asking it's connecting everything to a question and asking yourself, what could the leading indicators B, and this is why randomized controlled trials are very, very powerful methods to use.
And it sounds fancy, ultimate. It's just AB testing.
If you have a digital platform where you're augmenting your people, you can AB test everything, and you can then really get a sense of how people are interacting and behaving using that particular platform, those approaches.
I don't know if that really answers the question specifically, but it's kind of implicit because those are great insights that those are, those are, that is the type of commentary, and then we're looking to, Sean, terrific the time flies when you're having fun, and this thing just kinda blew by us. So, what is the best way for those in the audience to follow some of the work, the research that you do? Is there, Is there a place we can go that Canada, is that LinkedIn, is there a place where maybe you publish your work and your research?
I mean, I'm working with several universities like London School of Economics and Karlsruhe Institute of Technology and others around running several randomized controls and because the platform building is one of choice architecture, so it's very much based on on Richard Thaler and sunstein's Work and Nudge and, you know, a subsequent Nobel Prize winning research but basically looking at the behavioral aspects.
So, there will be research published from that as well.
But LinkedIn would be the place to go.
I will, you know, typically, except whoever, from this group, at least, if you just say, hey, what's from the conference, then, I'll accept you as a as a contact and if you have a specific idea you'd like to discuss, then we can continue the conversation through LinkedIn.
Sean, thank you for junior generosity, for sharing your expertise and insights of our global audience today. We really, really appreciate that.
Thank you for the opportunity, it's a great conference.
Thank you. Bye, bye.
Bye bye, ladies and gentlemen. That is Sean McCann Event, who is the Head of Strategy and Research at sap? Be directly from Germany to our global audience. Wonderful insights about measurement, about, About our intuition are about, but our biases and the, and so much more. So, thank you for his insights and, and, and, and practical perspectives as well. And that we are looking forward to taking a break right now. And when you come back, you're going to come back with me.
And what I'm going to share with you as the last session for our three day event is our the practical lessons for digital process automation from great and during organizations is an hour time.
Any organization or at least most organizations can do a successful automation here and they're accelerating innovation no, in fragments.
But what does it look like when organizations lead innovation for value creation, and have digital process automation as part of that, for more than a decade and not only they continuously improve.
They improve exponentially over time, what is the secret? It's not. what you see on the media, is not what you hear from. The one hit wonders, the ones that do an innovation here, A great automation there. How do you build that, as a key organizational capability in your organization? It's not easy, but I'm gonna lock the keys to digital process automation done at the greatest level.
We're gonna look at the fundamentals and how great organizations use those fundamentals to have to accelerate excellence, innovation, and value creation. So, I'll see you back at the top of the hour, where we're going to go deeper into that topic. So, Thank you for an hour, Enjoy a few minutes! Break!
 Dr. Sean MacNiven,
Head of Strategy and Research,
SAP.
Sean is the global lead for strategy and research for SAP's global product support organisation, with over 15 years of experience at SAP and as an independent consultant to organizations and government (including the European Commission).
Among the topics he leads, he is the chief architect of the support organisation’s strategy of minimising effort for employees and customers through the automation of insights and the digital augmentation of knowledge workers. Sub topics of expertise include the design of adaptive systems; gamification; measurement; research design; communications and PR impact, and social influence in online environments.
Furthermore, as global lead for organizational research, Sean partners with leading international universities to develop robust empirical measures for impact, and has introduced and is currently standardising the use of randomized control trials for all major projects and objectives. He is currently running several trials for the efficacy of nudge theory and choice architecture in terms of performance and engagement.
-2.png)
-2.png)


.png)

.png "Access all 75 Award Finalist Entires")


