


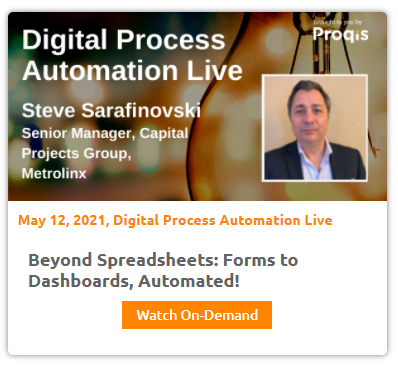
Courtesy of Metrolinx's Steve Sarafinovski, below is a transcript of his speaking session on 'Beyond Spreadsheets: Forms to Dashboards, Automated!' to Build a Thriving Enterprise that took place at Digital Process Automation Live.


Session Information:
Beyond Spreadsheets: Forms to Dashboards, Automated!
With the increased functionality of digital forms, unprecedented connectivity and the changes brought on by the Covid-19 pandemic, there are increased opportunities for organizations to easily make the most of these advancements. This approach can result in increased business efficiencies and streamlined business processes, leading to reduced time and effort, along with providing opportunities to standardize business procedures.
key outcomes of this presentation will be the following:
Session Transcript:
Very excited about our next guest. He's coming directly from beautiful Toronto in Canada to share his expertise of us. And I'm talking about Stevie ... Steve's, a natural leader with a diverse background which includes experiences in operations, technology, project management, transit, scheduling, and resource planning and management.
Steve has a vision for efficiency through process automation and has led many projects and initiatives that have transformed the workplace, resulting inefficient processes and reduced costs. Steve, it's always a pleasure to have you with us. You are a true leader and practitioner of digital process automation and I'm very much looking forward to your presentation.
Thank you so much Josie. Thank you for having me once again.
Very excited to, to be here and to talk about today's topic, which I'm calling Beyond dashboards.
Sorry to be on spreadsheets from forums to dashboards, automate.
So as Josie said, I'm senior manager and I'm where I work for the Business Services Group within the capital projects group of metrolink's.
Aye.
Essentially, bin bringing efficiencies to government for the past 20 years.
And I'm very excited about today's topic, and what we're going to share. So just a couple of agenda items here.
We're going to go over today's topic. So we're going to talk about what I like to call numbers to pictures.
Believe it or not, we're also going to talk about Napoleon Bonaparte in 18 12, and I'll tell you how, that fits in today's topic.
We're gonna talk about the rise of the form, and we're going to combine all of this, and bring to you a case study of how we use forums and dashboards to track leadership options that contributes to employee engagement at metro links.
And then we'll have some time for your questions.
Just a quick note, metrolink's is a crown agency of the Government of Ontario, and is responsible for managing and integrating the public transportation public transport in the greater Toronto.
Greater Hamilton Horseshoe region which includes Toronto, Hamilton and Ottawa. The organization is currently undertaking the largest largest transportation investment in Ontario's history to get Ontario and where they need to go better, faster, easier.
While also operating go transit up express and press them.
 The Capital Projects Group, whichever part is a division within metrolink's and is responsible for the organization's capital program which includes a P three type procurement and delivery methods.
Quick word on CPG.
Currently we have one of the largest transportation infrastructure builds happening in North America.
It's an approximately $50 billion portfolio. We have multiple expansion projects for subway projects and numerous ...
and BRT projects as well.
My key role within the business services area, it's supporting this bill.
And in sharing that, we have the right people at the right place, at the right time, for the right costs from a resourcing perspective, but as well as trying to make the administrative burden as easy as we can for our project delivery teams.
So, having said that, let's talk about data visualization.
As the definition, Data visualization is the representation of information in a form chart, diagram, or picture, A chart diagrammed picture that is created as a visual representation of information.
This is what I like to call numbers to pictures.
It's much easier for us to gain information from a picture than it is from a series of numbers As you can see here. And this isn't anything new. This is not a new concept.
I know today's world, we talk about dashboards and charts and graphs and tracking progress, but these ideas have been around for no thousands of years.
If you go back 12,000 years even, you can see where they use cave drawings to depict Steller that, but we don't have to go back that far.
We'll just go back to 17 86.
Where do you see this graphical depiction a chart or a dashboard, if you will, a graph, showing the trade imbalance between France and England at the time?
In 18 69, Charles Menard Graf of Napoleon's Russian Campaign, which we'll talk about in a little bit after this.
Some say, it was, the greatest depiction or the best depiction of that, uh, visually represented.
In 19 83, we had the Spark line chart that is still talk to students today.
Then 1990 is when we have the MS Excel, one of the most game changing tools for data visualization.
This empowered people to work with data and tables, and then with the push of a button, with the push of a button, provide a visual representation of that data.
And then we have present day.
Present day, we have numerous visual reporting software available to us.
We have products like Tableau, products like Qlik Sense, products, like Power BI.
All of this is basically a result of more processing power and the interconnectivity that systems have today.
I want to spend a couple of minutes going back in history, back to, to 18 69 when this, this graphical depiction here was created.
I'm going to briefly explain this to you and at the same time explain why I find this quite relevant and important.
So if you start out here you see that Napoleon, uh, during the year of 18 12, decided that as I'm sure most of you know, was going to march on Russia to take over Russia and Occupy Moscow.
So as you can see, they started off with 422 soldiers and as they're going on, this has a geographical representation as well.
And one thing that you can notice about this slide here is that it reduces all the way through on their March to Moscow. And this is how many soldiers they lost along the journey.
They reach Moscow with 100,000 troops.
Now, I'm sure many of you have heard from history class, but above about this particular war and retreat, What happened was that as Napoleon's forces were making their progress towards Moscow.
The Russians Develope, the scorched, earth policy, cutting off the supply lines to the French troops.
When the French troops arrived in Moscow, they found the City deserted and set ablaze Bye the Russian inhabitants.
So he stayed there a few weeks with his army with nobody to negotiate, no peace deal, supply lines. so you only had one choice, and that was to retreat and this is the yellow light.
And or the Golden line, if you want to call it and as they started making their way back.
You can see how many soldiers they lost along the way, and along the bottom here, this shows you the temperatures that were being encountered on the March back from Moscow.
 This tells you where, for example, at this river crossing, 50,000 soldiers were lost.
All in all, the campaigns started off with 422,000 soldiers.
And he returned with 10000.
In one series in one depiction in one graph.
You can get a valuable history lesson out of this, and this is why this is referred to as one of the most, or the best depiction, graphical depiction of of information.
That one I'll leave it for, for you to decide, but I've always said, I mean, if they've done things like this in 1969, um, with the processing power and the tools at our disposal today.
This is what our reality looks like.
This is present day data visualization.
Showing the I'm sure we're all aware of the covert numbers, the numbers of, of infected people.
Now we have the ability to take all of this data and show practically real time.
Data and information in a graphical representation.
So, that sort of talks about the graphical representation of data, But what we also need to consider, is the inputs of the of that data and where is this data coming from.
That's where the rise of the form happens.
A digital form is the equivalent of a paper document that is used to collect data. There's a great variety of documents that can be digitized.
It is more convenient to use digital forms in such situations that are, to avoid duplicating the data entry from the paper.
So if you think about what I just described in terms of the chart that was made in 1969, you can imagine that all of the data was probably written down.
As a matter of fact, I think it was one of Napoleon's pharmacists that was keeping track of, of the numbers. And.
Everybody's heard the saying, garbage in, garbage out.
we structure and form those data inputs?
Theseome early forums. This has taken around the same time as the.
Charles Menard napoleons chart was, was created around 1960.
This is a census form from the United States.
Census Office.
Then, you see, we come up in the 19 fifties. There's been a major change in the forums. We have more more tick boxes. The information is more streamlined.
Then we have more modern day ones. These are, I think, from the 19 seventies, so these are all paper forms.
This is all in an effort to control the data inputs, so that when we're creating visualizations and charts and different dashboards so that we ensure that we're only collecting the data that we need for the dashboards.
So then we come to electronic forums.
one of the most famous or very well-known form was the First Pizza Hut or Pizza Ordering Forum, as you can see on the screen.
I find this one very interesting compared to today's reality.
Because in 19 94, when pizza net was launched, what you had to do was fill in your name, your street address, and your phone number, and then somebody would call you back to order a pizza.
But we see today width.
Multiple form logic, with various flows, work flows behind the scenes, with the processing power, As you can see here, and I'm sure as we're all aware, we could actually customize our pizza with all a click of a button, and this is very important, as well, too, in this example, because the source information, it's coming from the customer.
So there's less duplication of of that.
Here's some other examples of forums.
On the left here, we see Google Forms, which was a game changer in the two thousands as well.
Then the one that I've been most familiar with for my career, the PDF application for Employment Form.
All right.
So, multi-step and interactive forms caught on.
We see more and more functionality being able to, to be used for streamlining the collection of, of the data.
So, what does all this mean?
What have I been sitting here talking about for the past 15 minutes, paper forms, and charts from the 18 sixties?
So I'm going to show you how these concepts when brought together, how we can address a real-world problem in order to make our organizations better, and in order to.
gain the insight into our organizations that's needed for success.
So, I'm going to change gears here, and talk about employee engagement, tracking leadership actions.
Metro links.
There's a focus on understanding employee experiences and taking the steps in their engagement.
Provide you some background in order to facilitate this engagement.
Metro Links is a very diverse organization. We have operating divisions.
We have almost construction divisions, customer service divisions, fare card responsibilities, and a fair fare card system.
And in order to have a consistent approach to leadership, they've come up, we've come up with the leadership actions.
So, each people leader is required to pick out a number of actions throughout a month in terms of employee engagement.
And those are monthly, one on ones with the direct reports, coffee chats, with staff, weekly business meetings, with their teams, walking the floor, where it's applicable and by walking the floor. What we mean is we have a lot of areas that that could be operating remotely or there maybe not in a centralized location.
So, we encourage the leadership to go out and walk the floor, then for the more senior leaders or divisional leaders, there's a requirement to hold town halls and provide this information to, to staff. These leadership actions provides opportunities for employees to drive change and hold each other and leaders accountable for creating an environment where success can be achieved.
-2.png?width=600&name=Email%20Graphic%20Virtual%20Conferences%20(1)-2.png) These ultimately result in improved employee experience, and positive employee experience will also lead to improved employee engagement.
These ultimately result in improved employee experience, and positive employee experience will also lead to improved employee engagement.
We do annual surveys, where we survey employee engagement from each of our staff, our, each of our employees, and if we're doing our leadership actions correctly, then, we, we hope to impact the employee engagement score.
So, this comes with this challenges as well. How are we going to record all of this information?
So, a digital process was put in place.
There would be a record of the leadership meeting.
Then that information would be filled out in Excel sheets, in spreadsheets, and then submitted to a reporting group that would compile all the spreadsheets and then disseminate the information accordingly.
The pro of this method, or the benefit of this method, is, we had a digital process, where meetings were being held and reported in individual Excel files.
But what we found, was that each people leader may have been recording the actions a little bit differently, than the other.
There was a lot of manual data mining to combine the various Excel spreadsheets.
There was not really a consolidated statistical output.
So then the then, you know, in the last 12 to 14 months, the coven pandemic.
Um, ravage us all an impact impact that all of our lives.
And the one, the one impact, the one tangible, I think for many of us watching right now, was the use of MS Teams.
So up until this point, thinking about everything that we've talked about, in terms of forums, in terms of collecting information in a consistent manner, in terms of visualizing data.
What we did, and here's an example of how the Excel sheets were were tracked.
And what we did for the automation is we use the MS Form's function in Teams to create the input.
That input then was saved in Microsoft Forums, SharePoint site.
Then using Automation, Flow in Power Automate.
We were able to compile this information and prepare it for and automate automated transfer into art Qlik Sense database.
And from there, we provided dashboards that provide details on all of the leadership actions.
So, using this process, we've essentially automated a digital process that was, that was in place and this led to much more consistent data reporting.
Lead to tracking data over over time.
And we maintain the source information.
With minimal duplication.
So, here's the form that we used. We created this leadership action tool.
This form is both available, web based and on mobile, and that's a really big thing for, for us.
We have a lot of regulations where a lot of our information is is secured. And we have to access it through our network, making mobile connectivity a little bit challenging.
However, using the Microsoft Team Suite and Forums, we're able to put this on both mobile, and share it on web based, as well.
And this is what we came up with. This is the output. This is our dashboard. This isn't a pilot. This information right now is we just tried a little pilot with some of our staff.
So as you can see over here the walk, the floor, we haven't had any of those. This group was not privy to those.
But now what we have is we can actually see the different areas where they're tracking to their targets.
We can see each department in relation to one another, and more importantly, this reinforces our commitment to all of our employees. Oh, sorry.
This reinforces our commitment to our employees that we will take on these leadership actions will improve engagement.
um, through these tools.
This resulted id.
Consistency, automate automated workflows, efficiency, reduction in data preparation time.
And there won't be any manual data mining in order to validate information displayed since the information is coming directly from the source, and being brought onto a dashboard.
So, with that, that brings us to the, to the end of our presentation.
And, with that, I'm open for any, any questions that anybody may have.
Am good, Steve. Thank you. Thank you for showing that. We are, we know that there is, there are a lot of lessons to what you have just shared with us Here. You have shared.
.png?width=742&name=Screenshot%20(4).png) Somewhat straightforward application of automation tools to get an important process, you know, automated.
Somewhat straightforward application of automation tools to get an important process, you know, automated.
Now, as I look at the comments and the questions in the background, also, I'm going to ask you to stop sharing your screen, so that the audience can see them in the bigger screen.
Um, as I look into that, what does this tell me about what's going on a deeper level in the organization? When it comes to automation. What lessons do you derive from this application to how you are implementing automation and natural links and all other areas of the business? How does that translate?
Well, um, where do you start making these incremental changes within the workplace? It sort of catches on, and then you have your colleagues from, say, oh, you were able to do that with Microsoft Forums. I've had colleagues from other industries as well. It seems like everybody's sort of started using MS themes around the same time.
And, you know, a lot of the functionality was still unknown to some people, and we were we were actually going to create going to create a project, that integrated forums software that plugged into our Qlik Sense solution and that required a lot of requirements gathering.
That was going to cost a lot of money.
We had to go look for budget, but then we just sort of looked at the tools that we already had, and utilize those, So, it, like you said, it's very, very simple.
But when people see the ease of use, and that's what I'm hoping to get out of presenting here.
I mean, if 1 or 2 people can can go back, I'm sure they all have teams, that you go back and try this themselves on using MS Forms.
You know, personally, and I've seen this in a comment there, as well, I think this is a great example, because we, when people think about automation, they often thinking about this very complicated process and system, right? And that they're thinking like, Oh, my goodness, how am I gonna automate this end to end process, to solve world hunger? And it's like, Well, maybe you, Don, Kyle, maybe you need should take a bite at a time, as you, as you have just said.
And so much, and people often talk about, you have to start small and scale.
You have to start small in scale, But people don't know how to start small and scale, and I think that respectfully, I think this is a great example on how you start small in scale, because you have a process here that is not overly complex. There is some complex driver process, but there's not an overly complex.
But it has a higher level of visibility with leadership, and I wanna I wanna focus on that a little bit, too. I think that's very, very clever to get something that's simple and also can be demonstrative to to the leaders in the organization of the power of automation. Don't want to put words in your mouth. But I'm curious about, about your perspective on that in terms of the leadership engagement.
And really how strategic a project, an L plus, small R Automation project Like this one can be right, and, and, you know, that's, that's really interesting when you say the smaller project it is, I totally agree.
However, there's over a thousand employees that are going to be affected by this mm, so, so, the solution is small, but it's impactful, and providing this visibility to senior leadership.
I mean, if, if our CEO can look on his measure, sort of the leadership actions from, from their team, from the smart phone application, on their phone, I mean, we've, like, if we go back five years, for example, that, that would have cost you.
I don't know how much money, or it just wouldn't have been possible, but to provide this type of visibility in near real time is invaluable, and that's just combining information, and presenting it in a way That's digestible for, for people.
And just how I explained. That's why I went back to show the Napoleon Chart, and all of that stuff.
It's just a matter of making it digestible for people, easy to understand, and most importantly, the ability to action the data.
So, the way we have the dashboard set up with this, It's, you're gonna know, OK, this group is not reaching their targets, That will, there'll be a correlation in the annual employee survey.
Most likely, we've even taken the extra step by adding something called, Manage Your Talking Points, Which our leadership, our senior leadership, will have a meeting, and they'll say, OK, we might want to make sure that this communication is communicated to all employees.
They provide that communication with a number.
And then, when subsequent leaders share that information with their employees, those management talking points are actually recorded.
And we can go back and say, OK, well, we're, we're sending the message to the employees.
Now, if the employees are saying they're not getting the message so then we can look back at, OK, our methods working, you know, are they not. But since we've been implemented the leadership action tracking, that was for pre cove it and things got a little crazy for everybody. I guess During the pandemic.
We have seen a change in in leadership and we've seen an increase in employee engagement.
That's one of the questions that has come up here. That about, if you can talk a little bit more about the reaction of the leaders to this automation, this new way of doing things. And also, of, the, of the professionals and employees in the organization, you know, to this leader self reporting, that it's how did, how have both groups taken there?
So, um, you know, at first, right away, you know, let's, let's be honest. Somebody's gonna say, oh, well, that's too much work.
I can't, I don't have time to, to sit there and track every.
Every meeting that I have with with my staff. I'm doing that on a regular basis.
Anyway, but what we're trying to show is that, by showing this transparency, and bye, tracking are our activities, in the most simplest manner that we can, I mean, these forums are literally dropped out. You, you selected, it takes, it takes minutes, so, previously, it was a little bit more cumbersome, but now it's, it's streamlined, they understand the, the value and importance of it.
And, I think, I think, it, really, it's really impactful when they see those types of results are showing up on the employee survey. When everyone starts meeting their targets, and say, Oh, you know what? You know, we made sure to get that communication out at over time.
Totally, sure, that all of the employee, it concerns regarding communication or shortcomings in their leaders, will be able to address these from, from a data driven perspective in a systematic way.
Very well. So, William Fuller makes a comment and has a question for you. First, he says that Accountability for leadership anxious actions is a powerful concept.
Thank you for sharing your example, and his question is, Is this now part of the leader evaluation process in any way?
Um, the, those are still maintained as performance reviews between ... leaders and their subsequent leaders.
There is, however, a portion of everyone's review that is tied to our corporate KPIs.
So the answer to that would be indirectly.
yes, because if we do, if we're all doing better on employee engagement, then that's all gonna reflect better on our, On Are under a year and reviews.
That's right. And the front timeline perspective, I don't, I, I don't know if he has be implemented long enough that you can see some sort of feedback response on your annual or I don't know what frequency you do your employee engagement surveys, but when do you expect? I guess just see some feedback on that.
So, so, this started a couple of years ago and it was very new to the organization.
So, everybody was sort of learning how to do it and there was some preliminary increases. There was some preliminary satisfaction.
The pandemic came along. It.
We have to sort of reset and that's what we're doing right now.
We're essentially and then we're we're rolling this out to make it easier for for everybody to do. So over time. We are definitely going to track it. We have the tools to track it again and hopefully, you know, in the future maybe I can come back and provide some results on that.
Farewell. We're going to be looking forward to that. Fascinating, fascinating reveal. And the, and the and these sites aren't you onto this practice. So, Steve, thank you so much for sharing your expertise and wisdom with our audience today. We're grateful for for your generosity in doing so.
Thank you so much, It was a pleasure.
Thank you.
Ladies and gentlemen, that was Steve ... leader at the Capital Projects. Rupa Metrolink's sharing how leadership processes are taken advantage of digital process automation in their contexts. So very good application on on how we can scale automation in a very meaningful way in the organization, start small and scaly.
You're hitting the right influencers in the organization and the mystifying what process automation, digital process automation can bring to the organization.
I love that because he could have focus on, OK, this is what we're trying to automate our capital projects, proposal process for multi billion dollar investments.
That's going to be a much more complex process now to automate, and probably not the one that you want to start with in your organization if if you want to get traction on things. So, wow. You have to pick your battles carefully.
Pick Battles big enough. Isn't that big enough to matter?
But, small enough that you can win. Remember that. Big battles, big enough to matter, small enough that you can win. So, with that, we're gonna close this session and we're gonna close this day of digital process automation, live. Let me give you a preview of what's coming tomorrow. We're gonna have outstanding presentations from Global Industrial Leader as much like today.
And we are going to bring a health leader from UPMC health and she's going to be talking that's Angela Perry. Angela ... Theory is a leader on the strategic alignment, transformation and consumer innovation for UPMC health. And she's gonna talk about aligning population health and digital transformation. We're talking about big impact, digital transformations from social and economic standpoint. After that, we're going to embark on the journey with doctor Sean, Mac, Nathan who is going to be coming directly from the headquarters at SCP in Germany. And he is going to be sharing performance anxiety. How to define and measure what really matters for organizations. So doctor ... is the head of strategy and research at saint Pete, and he's going to be doing a fantastic reveal of, on how you identify what matters most.
And we are going to cap our conference and the last day tomorrow with Rajiv ...
and georgiev is is the head of portfolio delivery of test and trace digital at an HHS digital. So he's going to be talking about how are we using AI related technologists to automate? And the question is, are we automating enough with the AI related technologies that we have today?
He's going to show you examples on how that's being done on NHS Digital. And it's, it's going to be a fascinating review of applications as well. So, I look forward to see you tomorrow at this same channel. And the Glen having a wonderful day there with wonderful experts, cross industry experts from all over the globe, sharing their knowledge and wisdom directly with us.
So, for today, if you want to engage further, I'm going to be posting on LinkedIn. Right now, I'm going to be posting a comment under the posting. That's under, my name is Joseph Various on LinkedIn under the digital process automation live conference. Go, look up my name. Go look for the posting. Thank the sponsors. Thank the speakers. Ask, follow up questions. Do whatever you would like to reveal. Some reveal. Some of the commentary that I'm going to be posting there, and, and I hope to see you back here. And for the rest of your day, wherever you are in the world, have a wonderful rest of your day, And I hope to see you again. Tomorrow, take care of drawing.
-3.png?width=235&name=more%20(35)-3.png) Steve Sarafinovski,
Steve Sarafinovski,
Senior Manager, Capital Projects Group,
Metrolinx.
Steve Sarafinovski is a natural leader that began his career on the front lines of the transit industry, and has progressed his versatile background through his experiences in operations, technology project management, transit scheduling and resource management.
Currently, as a strategic leader in Resource Planning and Optimization of the Capital Projects Group division at Metrolinx, a crown agency of the Government of Ontario, Steve does what he does best which is exploring and finding opportunities by implementing efficiencies and automated processes within his projects portfolio.
Being a recipient of the Innovation Award at Metrolinx, as well as being awarded the “Top 40 Under 40” honours from the transit industry, achieving success in implementing new and more efficient processes, has been the cornerstone of his career. Steve is also the Founder of KJS Group, a consulting firm that offers expert management consulting and strategic planning advice for small to medium businesses.

-2.png)
-2.png)


.png)

.png "Access all 75 Award Finalist Entires")


